
The current SOL market is showing a weak oscillation pattern after a significant decline. The spot and contract prices are basically at parity, with a very small price difference, but the prices are significantly below the MA200 and the cost of positions, reaching the lower Bollinger Band, indicating oversold signs on the technical side. However, contract transaction volume has sharply declined, market liquidity is tightening, and the divergence between bulls and bears is increasing. Overall, the environment leans towards pessimism but is not in extreme panic.
Key Price and Range Structure
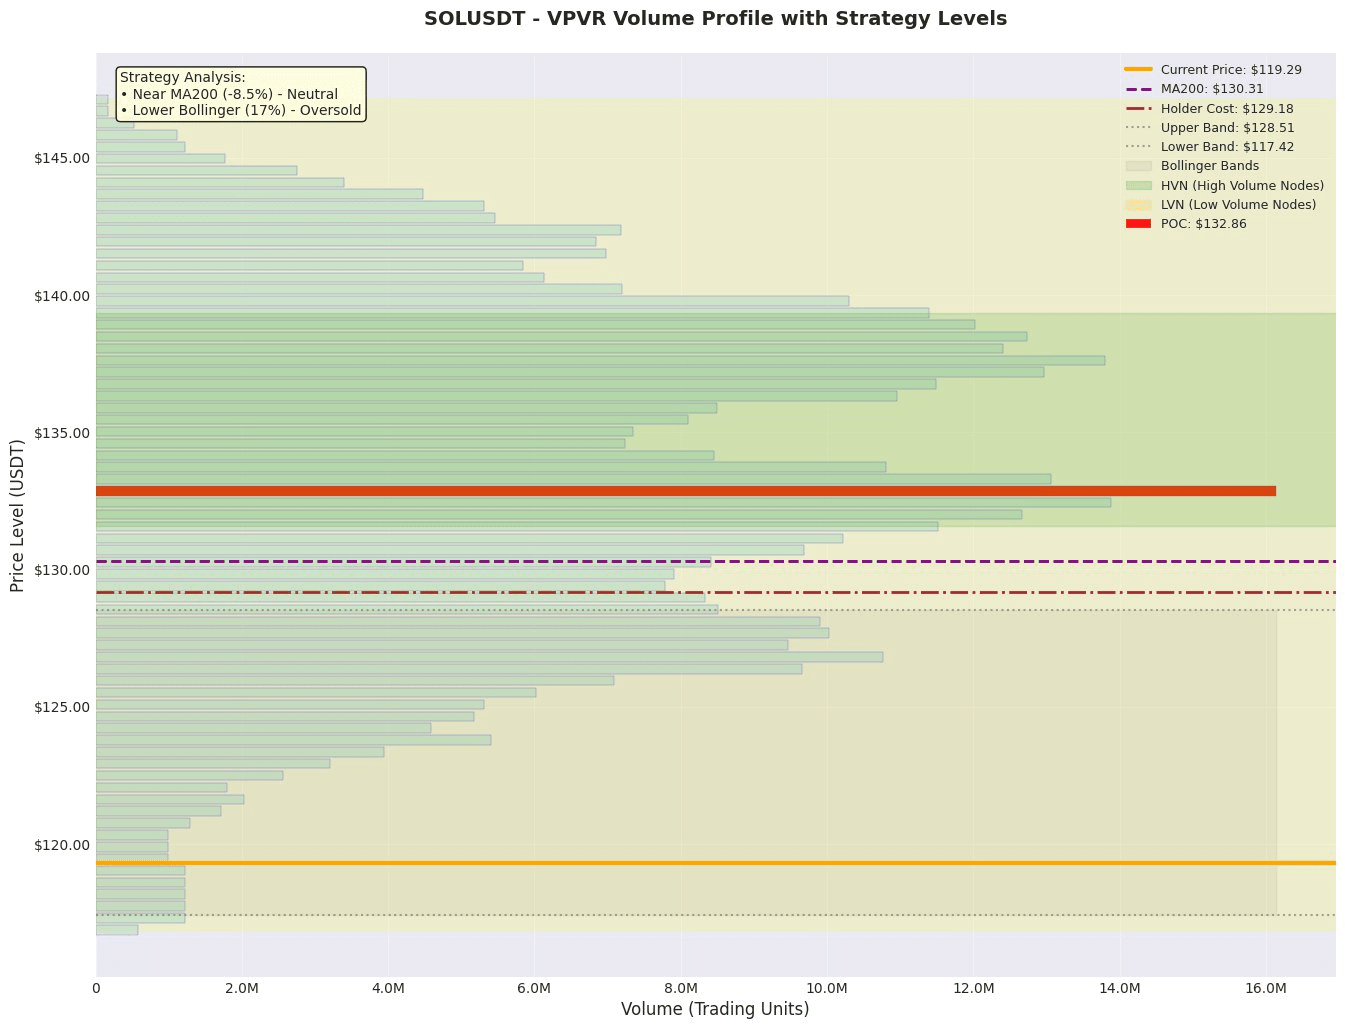
1. Value Anchoring Zone: According to VPVR, the current market's value anchoring zone (Value Area) is between 126.38 and 139.78, where the POC (Point of Control) is at 132.86. The current price of 119.29 is significantly below this area, indicating that the market is in a state of 'undervaluation.' In the short term, this area (especially the lower bound at 126.38) will become the primary strong resistance zone for a rebound.
2. Trend and Volatility Range: The current price of 119.29 is approximately 8.5% below MA200 (130.31), located in the lower half of the Bollinger Bands (117.42 - 128.51), with a specific percentile of 16.9%, close to the lower band. This indicates a bearish trend in the medium to long term, while short-term volatility is at the edge of being oversold. The lower Bollinger Band at 117.42 is a key intraday support.
3. High Volume/Value Area (HVN): VPVR shows a high volume value area of 126.38-139.78 above, creating dense resistance. In addition, the order book shows a significant accumulation of sell orders at 150.0 and 160.0, forming clear long-term resistance levels. Below, there are significant buy orders at 110.0 and 100.0, creating psychological support.
Derivatives and Liquidity Analysis
• Leverage Bias and Crowding: The funding rate is slightly negative (-0.00004977), indicating that the contract market is slightly biased towards bearish, but sentiment is not extreme. The long-short ratio has risen from 1.8361 to 1.9925, showing an increase in long positions, which may be a 'catching a falling knife' behavior during the price decline, warranting caution.
• Liquidity Signal: The contract trading volume plummeted by 50.3% within 24 hours, a strong signal of market hesitation or liquidity exhaustion. Typically, this follows significant price volatility, where trading activity drops sharply as the market waits for new directional choices.
• Leverage and Position Recommendations: In an environment of sharply declining volume and uncertain market direction, high leverage should be avoided. It is currently more suitable to maintain light positions or wait for the volume to recover and for clear signals at key support/resistance levels before making decisions.
News and Event Impact
The current news summary mainly consists of routine industry information, such as Anthony Scaramucci mentioning Solana's potential in reducing transaction verification costs, as well as routine reports from media like U.Today and The Block. The sentiment of these news items leans towards neutral to mildly positive but lacks heavy catalysts that could immediately reverse market trends. The impact on short-term price movements is limited, with market focus still on technical aspects and capital games.
Trading Strategy
Plan A: Conservative - Oversold Rebound to Try Long
• Direction: Light Position to Try Long
• Entry Range: 117.50 - 119.50 (based on the lower Bollinger Band and current price area)
• Stop Loss: 115.00 (placed above recent major buy orders at 110.0 and below the lower Bollinger Band by a certain margin)
• Target Level:
1. First Target: 126.40 (Lower edge of Value Area, strong resistance)
2. Second Target: 130.30 (near MA200)
• Expected Risk-Reward Ratio:
• Calculating with entry price of 118.5, stop loss at 115.0, target at 126.4: Potential Profit = (126.4-118.5) = 7.9, Potential Loss = (118.5-115.0) = 3.5, Risk-Reward Ratio = 7.9/3.5 ≈ 2.26
• Calculating with entry price of 118.5, stop loss at 115.0, target at 130.3: Potential Profit = (130.3-118.5) = 11.8, Potential Loss = 3.5, Risk-Reward Ratio = 11.8/3.5 ≈ 3.37
Plan B: Aggressive - Shorting on Rebound Resistance
• Direction: Short
• Entry Range: 126.00 - 128.50 (from the lower edge of Value Area to the upper Bollinger Band resistance area)
• Stop Loss: 130.50 (placed above MA200)
• Target Level:
1. First Target: 119.30 (previous low and current price area)
2. Second Target: 117.50 (lower Bollinger Band)
• Expected Risk-Reward Ratio:
• Calculating with entry price of 127.0, stop loss at 130.5, target at 119.3: Potential Profit = (127.0-119.3) = 7.7, Potential Loss = (130.5-127.0) = 3.5, Risk-Reward Ratio = 7.7/3.5 ≈ 2.20
• Calculating with entry price of 127.0, stop loss at 130.5, target at 117.5: Potential Profit = (127.0-117.5) = 9.5, Potential Loss = 3.5, Risk-Reward Ratio = 9.5/3.5 ≈ 2.71
Risk Warnings and Position Management
1. Liquidity Risk: Contract trading volume plummeting by 50.3% indicates insufficient market depth, which could lead to severe and unpredictable slippage at key price points, amplifying trading risks.
2. Trend Continuation Risk: The price is below MA200 and cost of position, indicating that the overall trend remains bearish. An oversold rebound may only be a continuation of the downtrend; if it cannot effectively stay above the lower edge of the Value Area at 126.4, the downtrend may continue.
3. Long-Short Ratio Increase Risk: The long-short ratio has risen to 1.99, and if the price continues to fall, it could force bulls to liquidate positions, creating an accelerated decline situation of 'longs killing longs'.
Position and Risk Control Recommendations:
• Given the aforementioned risks, it is strongly recommended to adopt a staggered position building strategy, with any single opening risk exposure not exceeding 1% of total capital.
• The total position should be kept at a lower level (for example, not exceeding 10%-15%), and high leverage should be strictly avoided (recommended leverage multiplier ≤ 3x).
• If the price consolidates at key levels (such as the lower band at 117.4 or resistance at 126.4), with contract trading volume remaining sluggish or the funding rate showing extreme negative values, entry should be delayed, and observation should be prioritized.
Like and follow for real-time updates!
$SOL
