
The current ETH spot and futures market is in a weak oscillation pattern, with prices significantly below the medium to long-term moving averages (MA200) and average holding costs, indicating an overall bearish trend. However, the market has not shown extreme panic, as the 24-hour trading volume has increased and buying pressure is significant, suggesting a strong willingness to bottom out near key support levels. The market is experiencing a phase of consolidation in the tug-of-war between bulls and bears.
Key prices and range structure
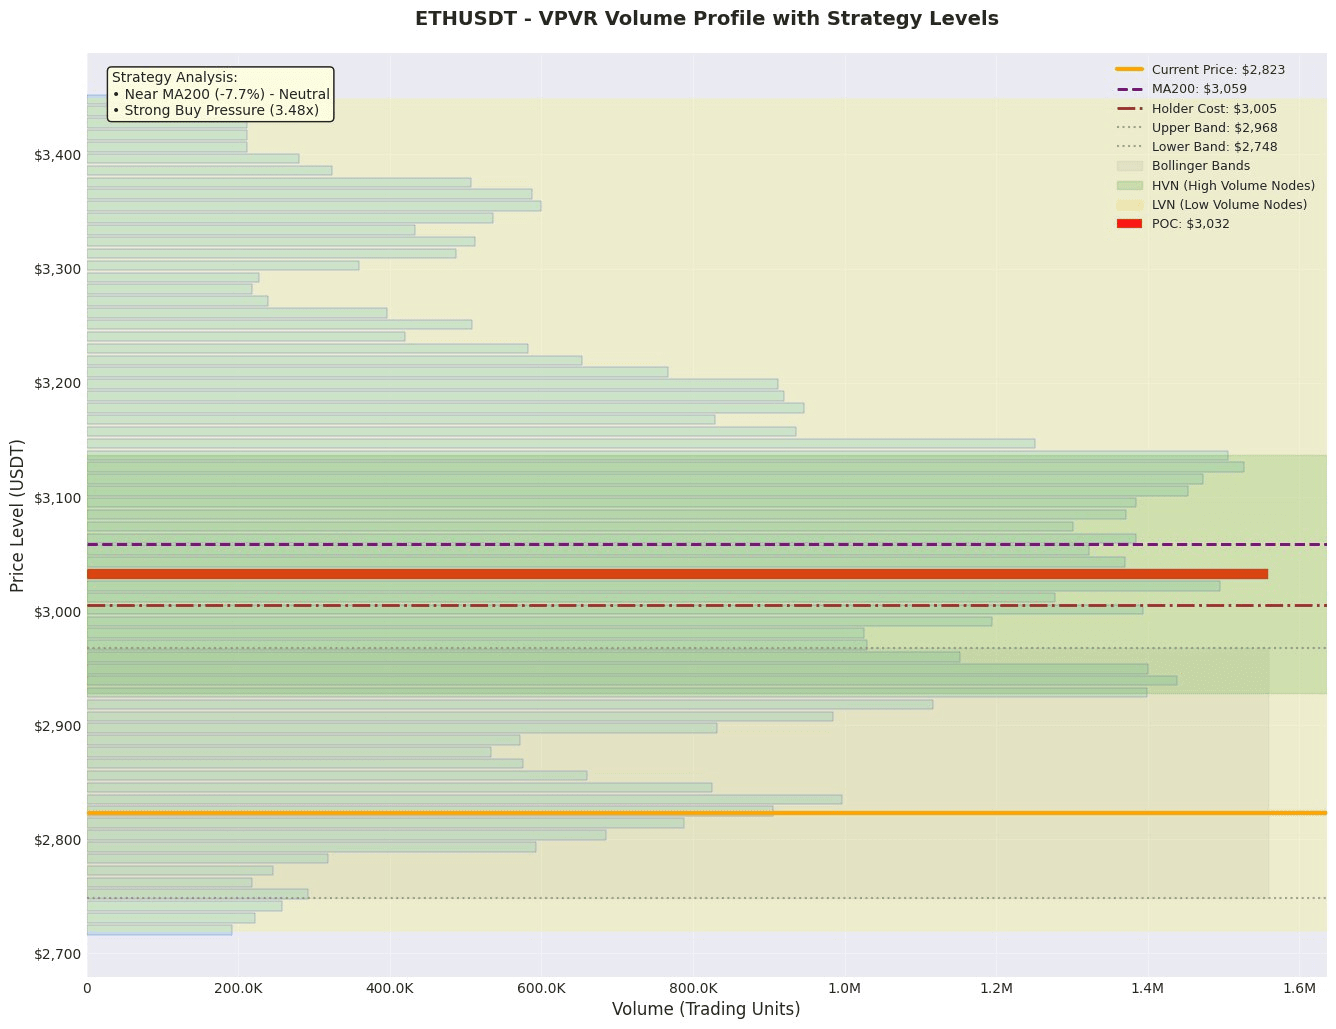
1. Value anchoring zone: According to VPVR, the value anchor (POC) for this round of competition is at 3032.45, while the value area ranges from 2824.54 to 3198.78. The current price of 2822.67 is right at the lower edge of the value area, which is a critical boundary for determining whether the price has entered an oversold zone or is reverting to value. If the price stabilizes above this area, it is expected to return to the POC; if it breaks below, it may look for new support levels.
2. Trend and Volatility Range: MA200 (3059.04) constitutes a key resistance above, with the price being about 7.7% below it, confirming a medium to long-term downward trend. The Bollinger band range (2748.24 - 2967.76) is narrowing, with the current price at a low position of 33.9%, indicating that the price is weakly operating in the lower half of the range, and the Bollinger lower band (2748.24) is an important short-term support.
3. High Trading Volume/Concentration Area (HVN): POC (3032.45) and the upper edge of the Value Area (3198.78) are the main HVNs above, which will constitute strong resistance for rebounds. No specific HVN data is provided below, but based on the major buy orders, there is significant buying interest near 2750.0 and 2730.0, which can be viewed as important support concentration areas.
Derivatives and Liquidity Analysis
• Leverage Sentiment: Funding rate (0.00003085) is close to neutral, and the long/short ratio (2.6963) still leans towards longs but has slightly decreased, indicating that leveraged funds have not become extremely crowded, and market sentiment is cautiously bullish.
• Liquidity Signal: Contract transaction volume plummeted by 41.1%, but open interest (OI) remains high at 5576.62M. This indicates a decrease in market activity, but the existing speculative funds have not been withdrawn on a large scale, which is a typical scenario of low-volume consolidation, not liquidity exhaustion.
• Leverage Suggestions: In the current environment of low-volume oscillation, with prices at key support areas, it is not suitable to increase leverage. It is recommended to reduce positions or stand aside, waiting for clearer volume direction signals before making decisions to avoid false breakout risks.
News and Events Impact
The news summary mentions that 'Coinbase Premium Index Turns Negative, Raising Fears of Whale Panic Selling', indicating that the Coinbase premium index has turned negative, raising concerns about whale panic selling. This news sentiment is slightly bearish and may exacerbate market worries about short-term selling pressure, explaining part of the recent price pressure.
Trading Strategy
Plan One: Conservative Bottom Fishing Plan (Long)
• Logic: The price is close to the lower value area and a significant buy order support zone, with considerable buying pressure, betting on a rebound.
• Entry Range: 2750.0 - 2770.0 (combined with Bollinger lower band 2748.24 and major buy orders)
• Stop Loss: 2720.0 (set below the major buy order 2730.0)
• Target: First target 2967.76 (Bollinger upper band), second target 3032.45 (POC)
• Risk/Reward Ratio: With an entry at 2760, stop loss at 2720, and target at 3032, the expected risk/reward ratio is approximately (3032-2760)/(2760-2720) = 272/40 ≈ 6.8
Plan Two: Aggressive Breakout Plan (Short)
• Logic: If the price cannot stabilize at the lower edge of the value area, it may continue to probe lower, triggering stop-loss orders after breaking key support.
• Entry Conditions: Price breaks below 2748.24 (Bollinger lower band) and confirms, or rebounds to 2889.02 (major sell order) and faces resistance.
• Entry Range: Chase shorts after breaking below 2745, or short at highs in the 2880-2890 range.
• Stop Loss: Set short stop loss above 2900 (or entry candlestick high + ATR, data missing, replaced with integer value).
• Target: Looking down to 2650.0 (based on support moving down estimates).
• Risk/Reward Ratio: With an entry at 2745, stop loss at 2770, and target at 2650, the expected risk/reward ratio is approximately (2745-2650)/(2770-2745) = 95/25 ≈ 3.8
Risk Warning and Position Management
1. Main Risk: Contract transaction volume plummeted by 41.1%, market depth is insufficient, and large orders can easily trigger severe price fluctuations (spike). The long/short ratio remains high, and if the price drops, it may trigger a long squeeze.
2. Position Management: It is recommended to build positions in batches to avoid full exposure at once. The total position risk exposure should be controlled within 1%-2% of the total account funds.
3. Risk Control Suggestions: Strictly avoid using high leverage (recommended ≤5x). If the price experiences rapid reverse fluctuations at key levels (such as 2750 or 2889) accompanied by abnormal trading volume, it is advisable to immediately reduce positions or stand aside. Until trading volume recovers, focus on light position short-term trading.
Like and follow for real-time updates!
$ETH
