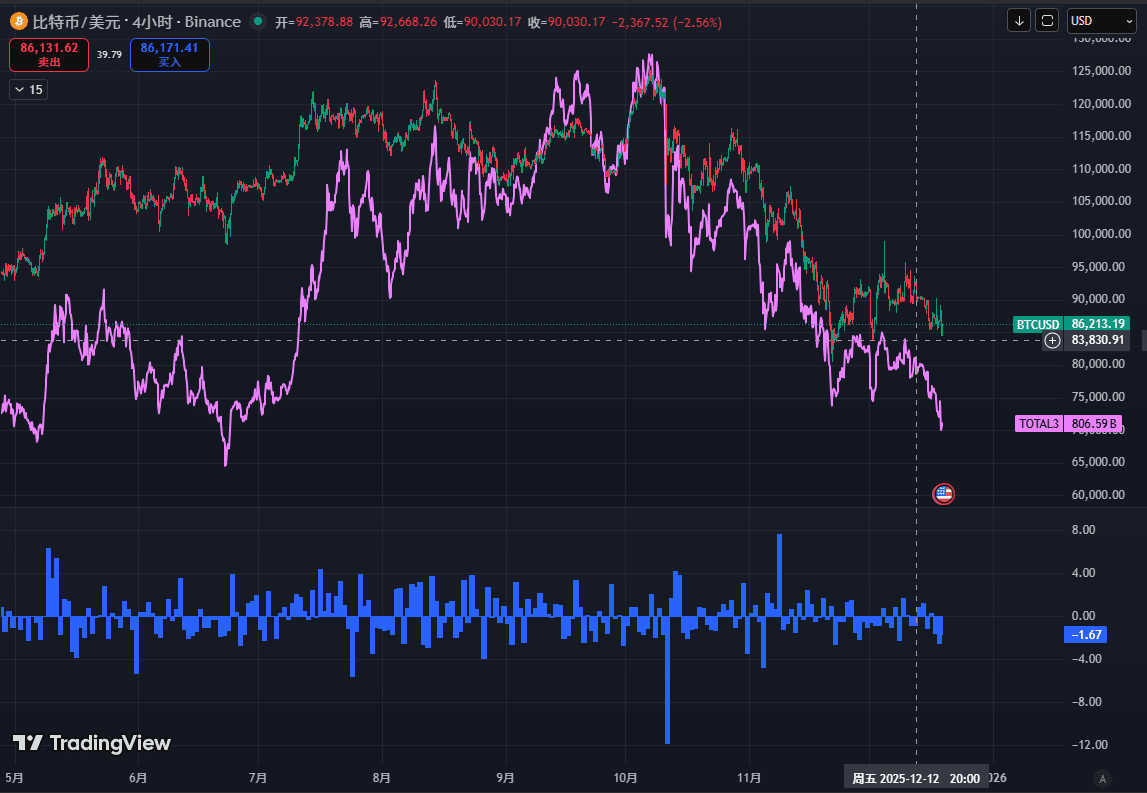
Last week we pointed out that the market is in a pattern of 'weak upward movement and limited downward movement'. This week's market continues to show a bumpy trend, with $94,000 always being a strong resistance level that is difficult to break through. The rebound that started at the end of November essentially belongs to a weak rebound, which is the core logic behind our continued suggestion to try short-selling strategies last week.
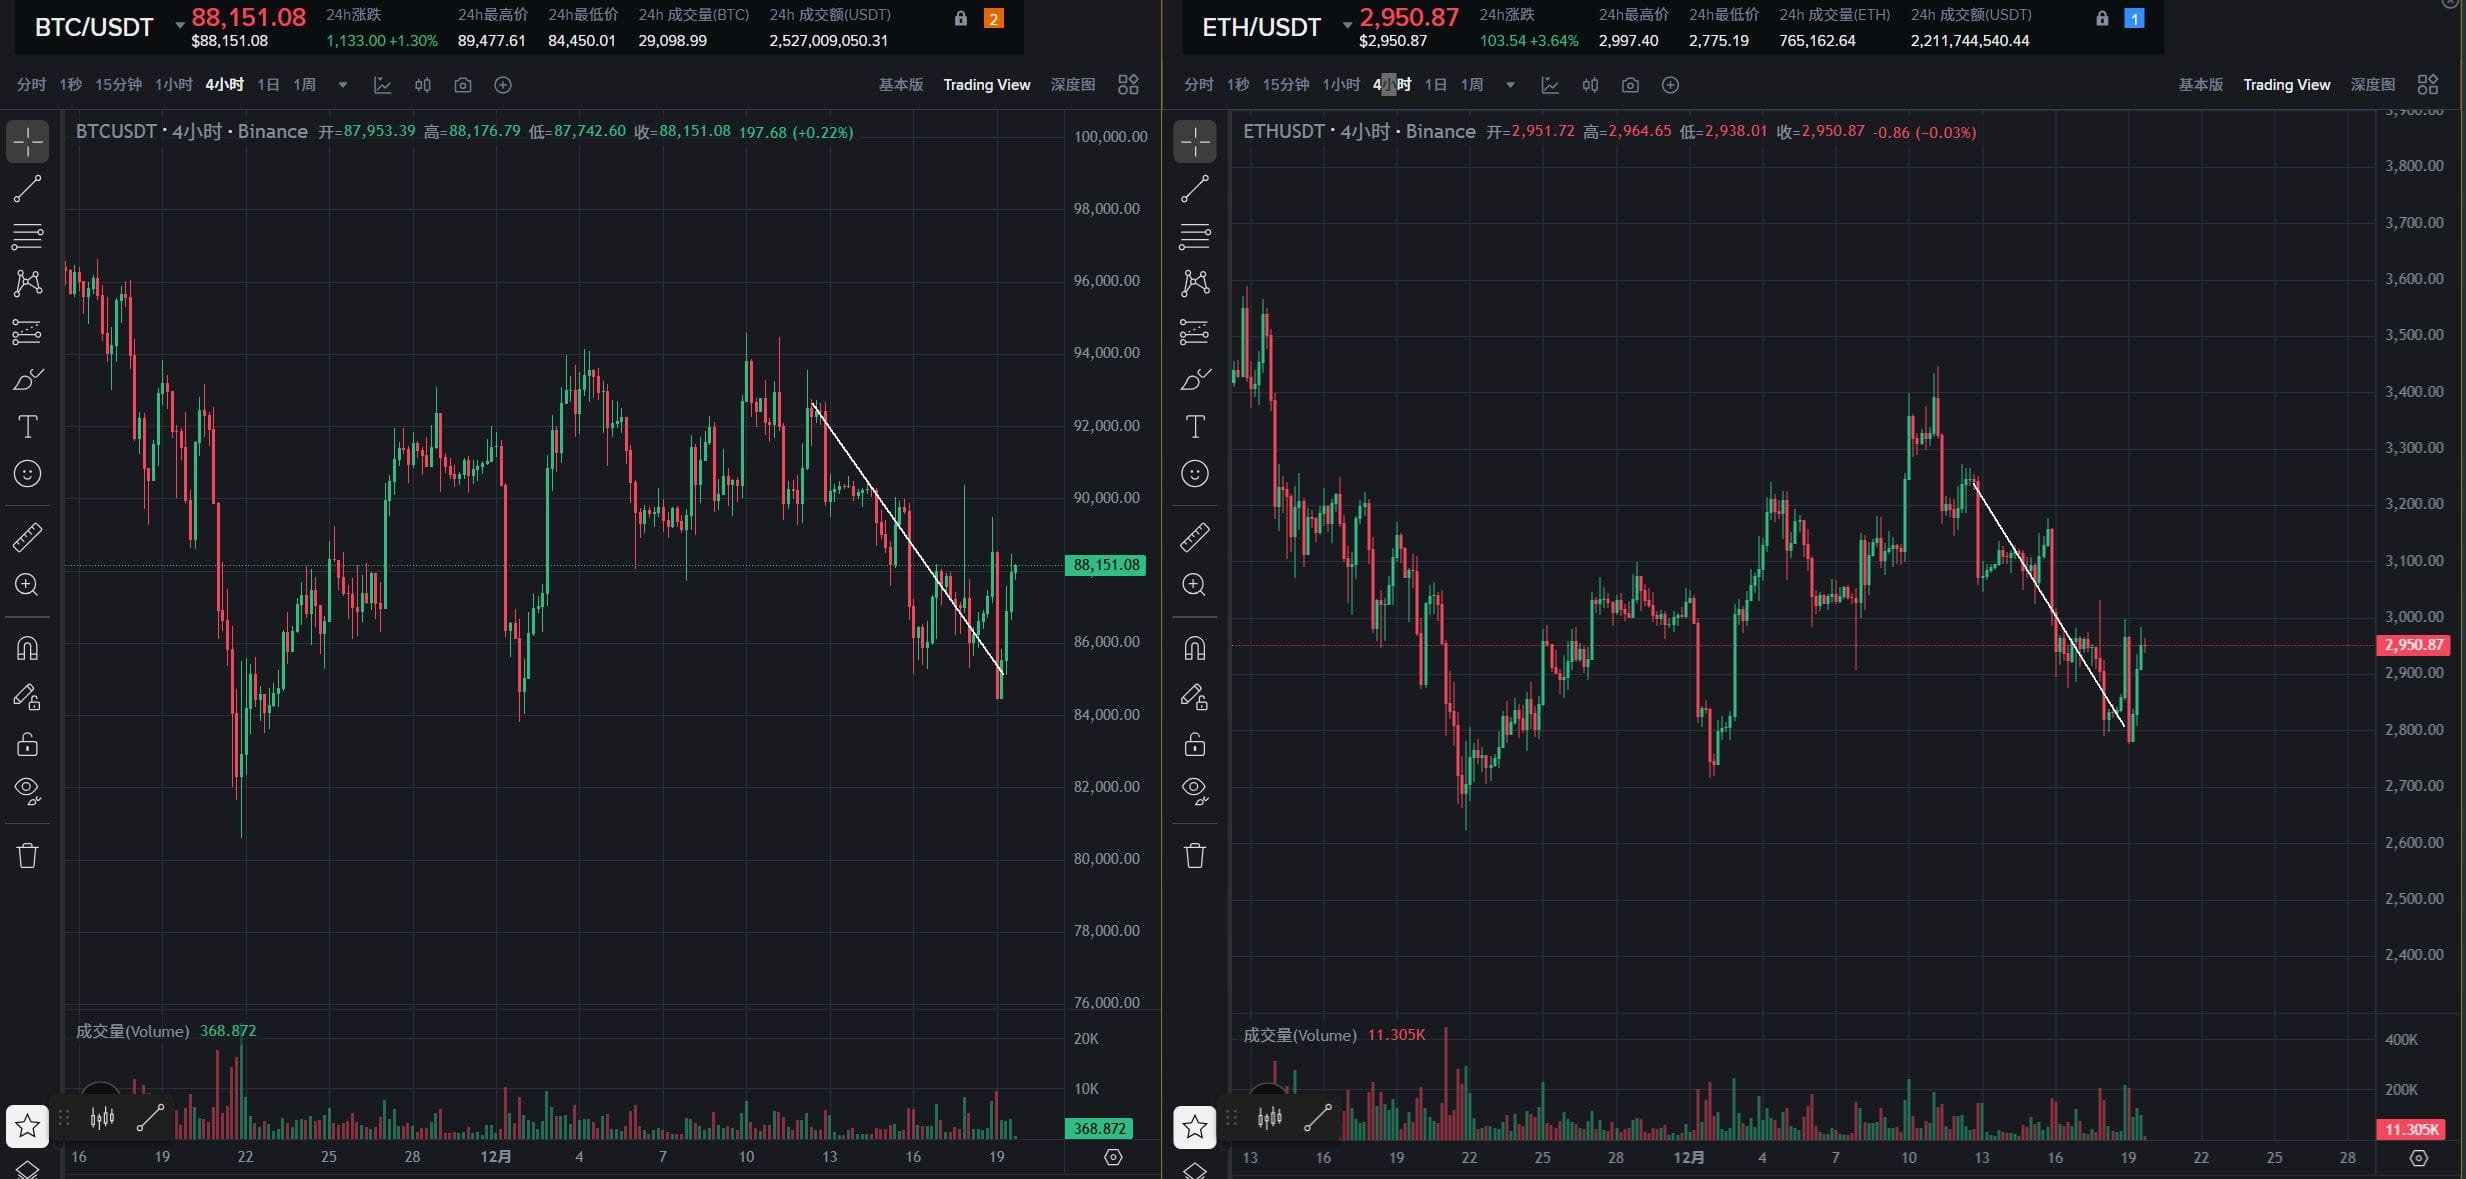
This week the market has shown a trend of oscillating downward, with extreme volatility in price movements, compounded by the dense release of macro news this week. The price has $85,000 as a bottom support, staging multiple rounds of 'door painting' market. From a technical analysis of the daily cycle, the effectiveness of the support in the $85,000 area still exists. As long as this level is not effectively broken, the market still has a chance to initiate at least a 4-hour level rebound.
1. Changes in short-term data affecting market trends this week
1.1 Stablecoin capital flow situation
This week (12.13-12.19), the stablecoin market's liquidity has further tightened, and the issuance speed continues to cool down. Data shows that the weekly issuance amount changed from $860 million last period to -$824 million (net outflow), and the average daily issuance amount decreased from $123 million to -$117.7 million, with an overall month-on-month decline of 196%.
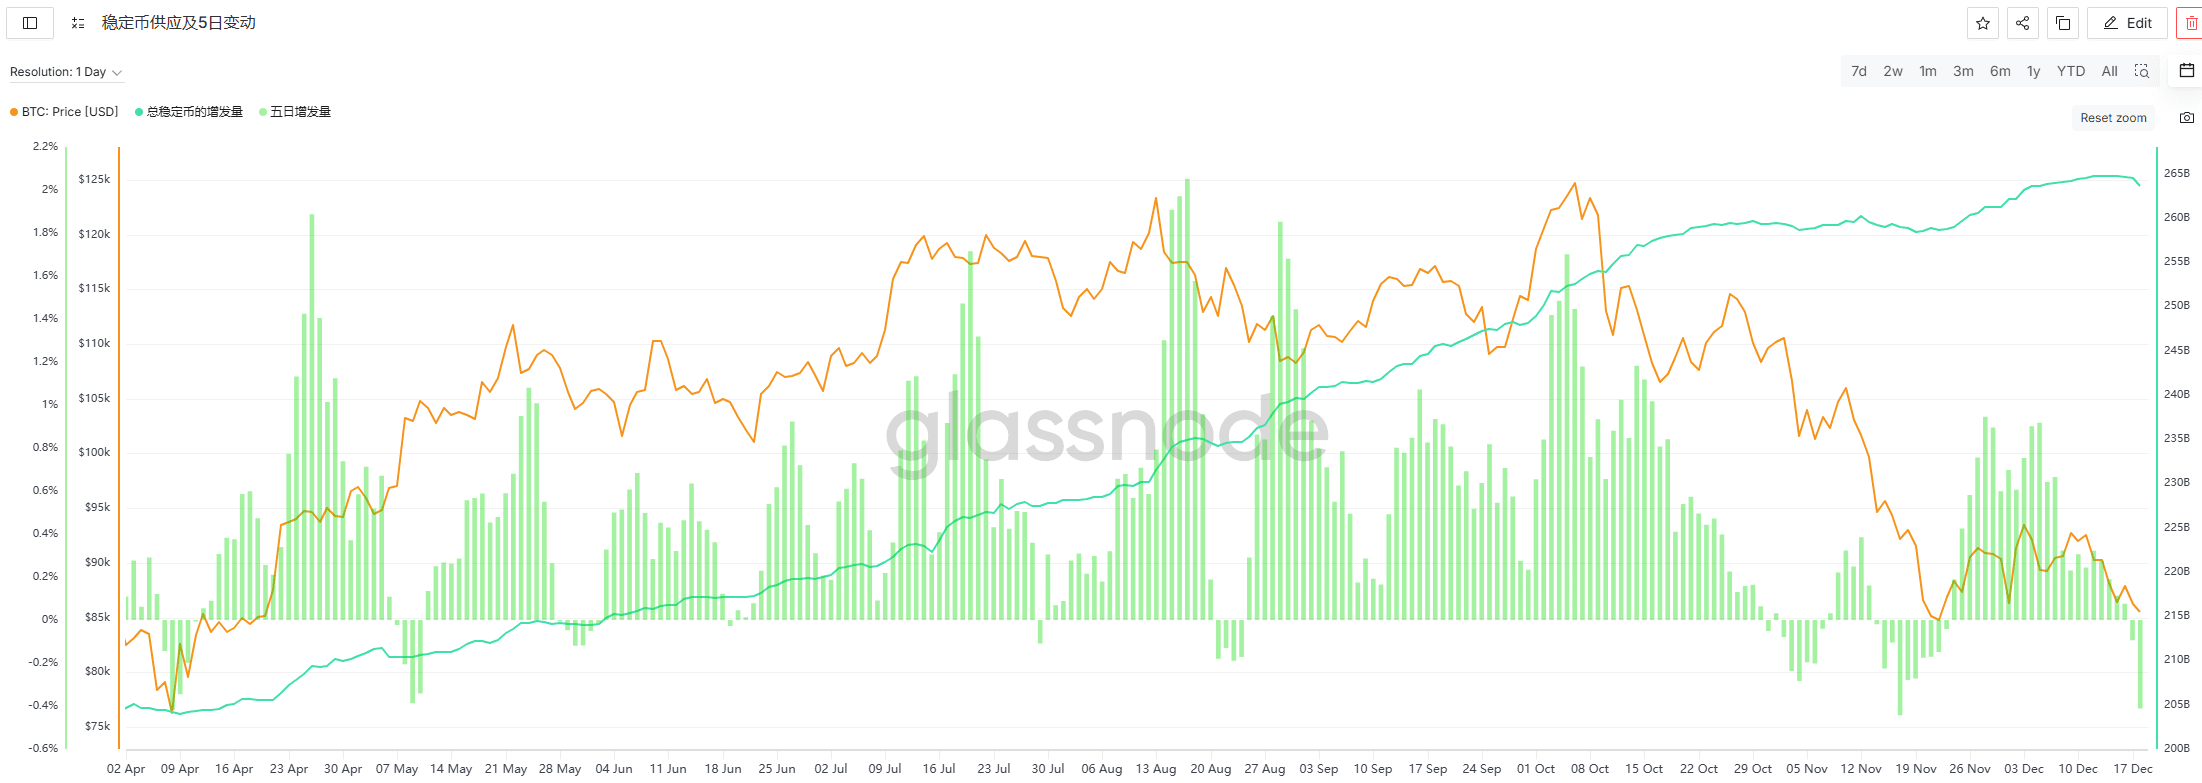
The net outflow of stablecoins starkly corroborates the market's downturn this week, with clear signs of capital exit. Whether the broader market can stop falling and stabilize will depend on the warming of stablecoin issuance data, which will be an important leading indicator.
1.2 ETF capital flow situation
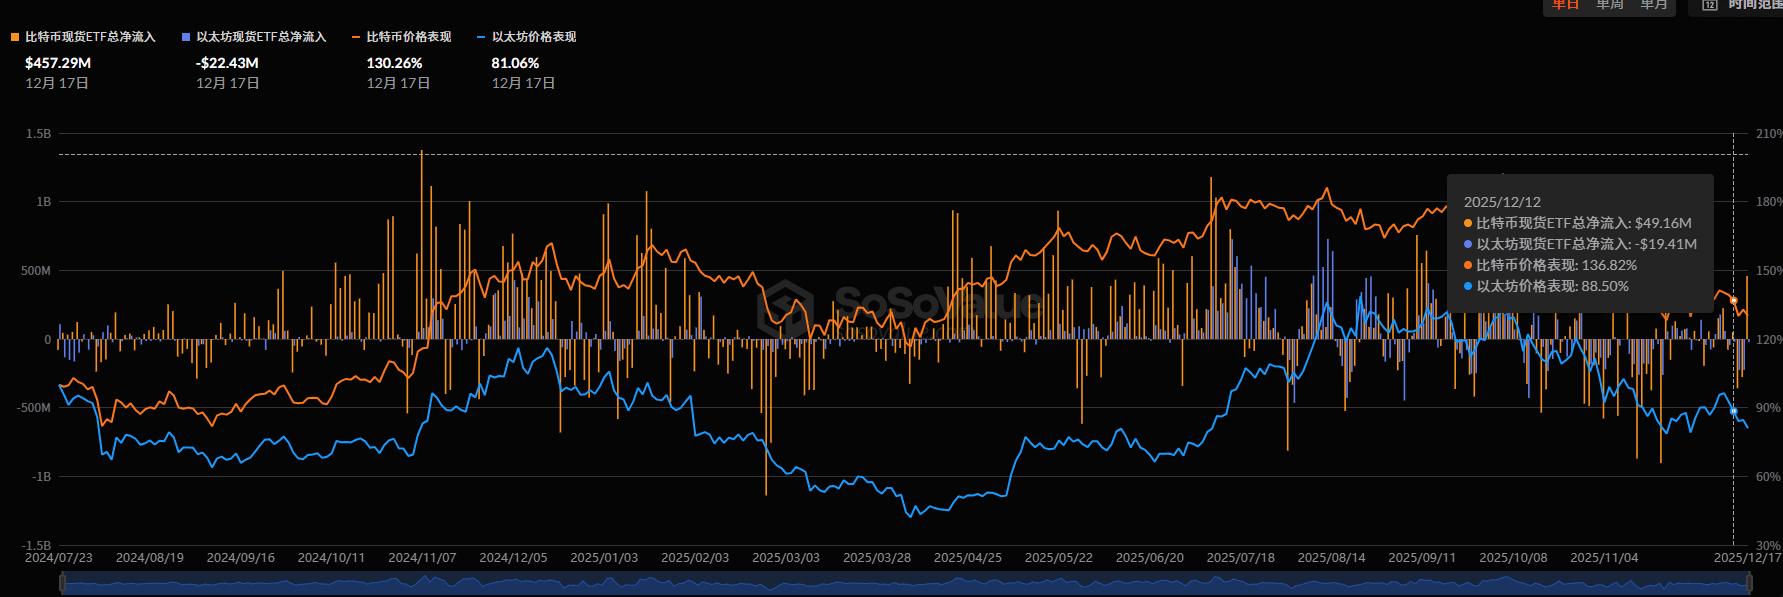
This week, Bitcoin ETFs fell into a net outflow state again, with a net outflow amount of $289.65 million for the week. Analyzing the daily capital flow histogram reveals two key characteristics:
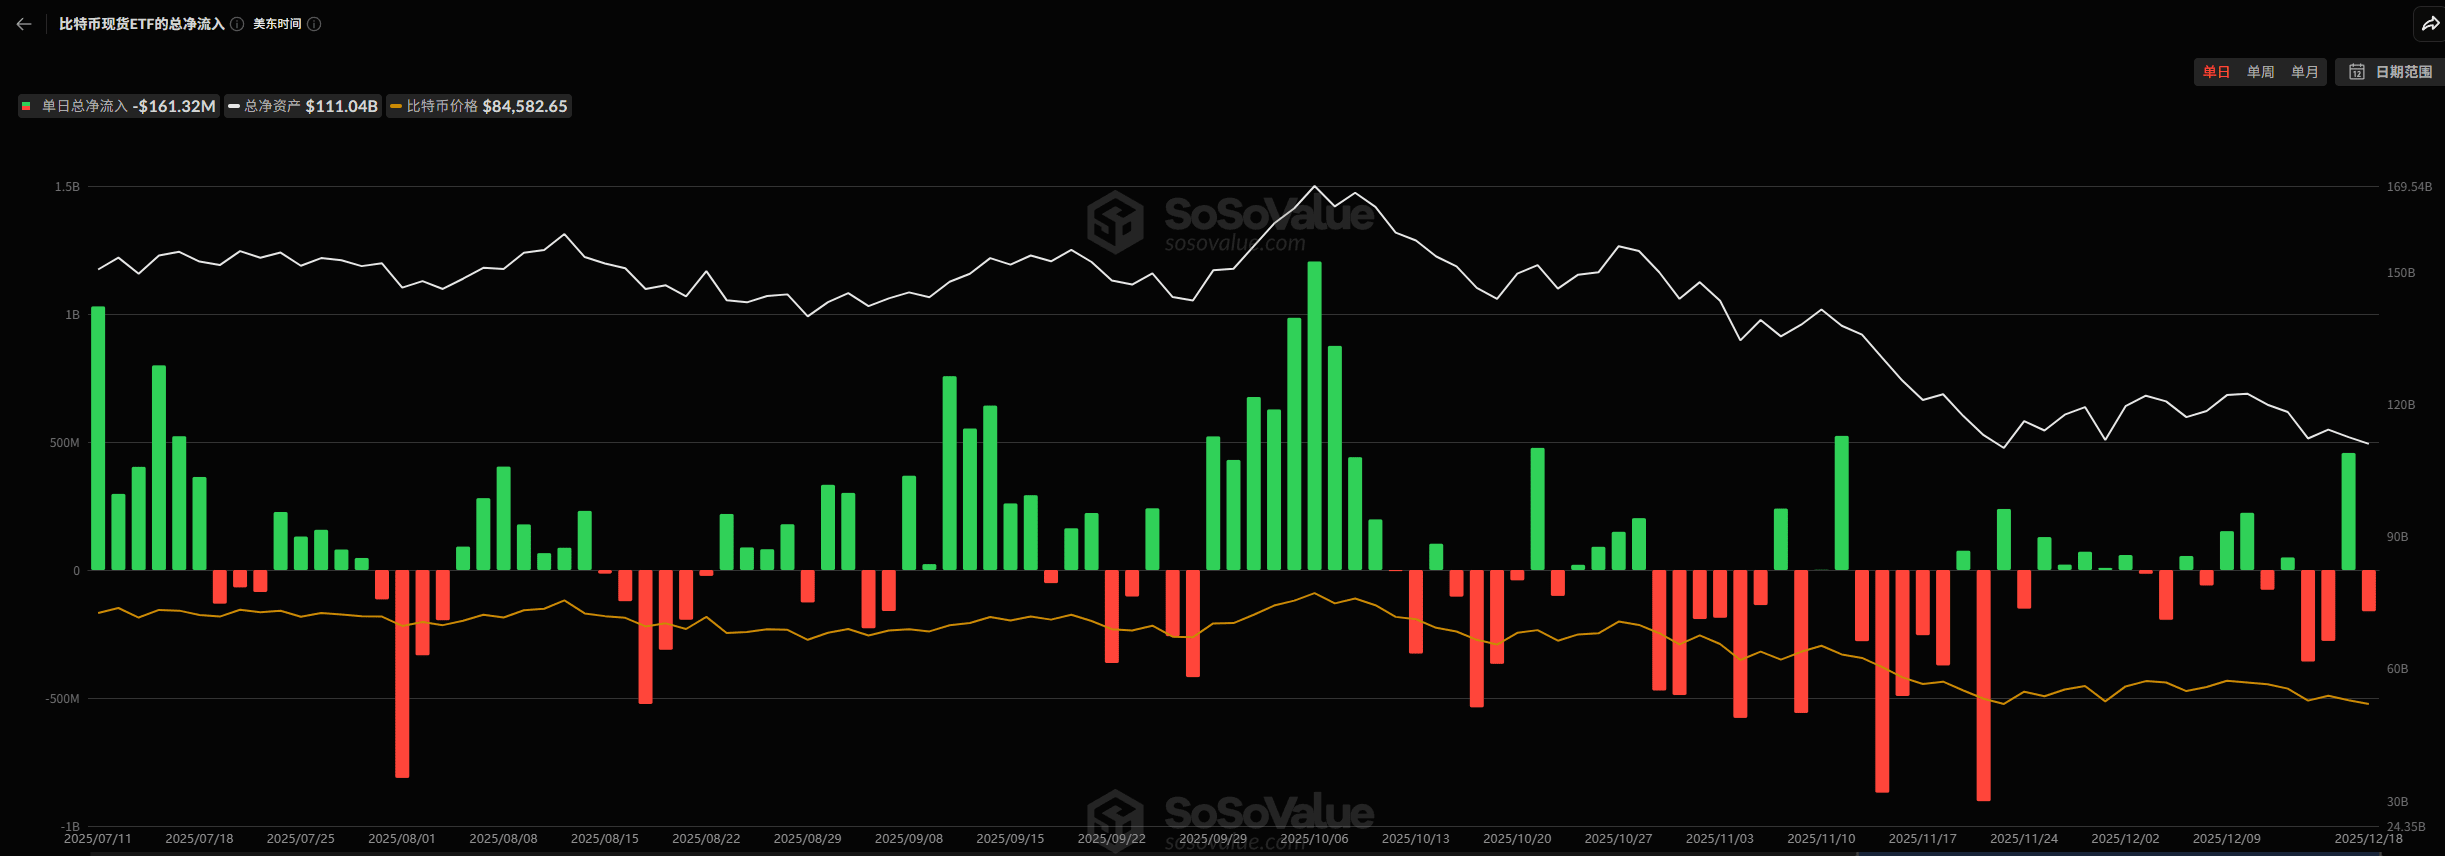
The daily net outflow scale is showing a weakening trend day by day, with marginal alleviation of the pressure for capital exit;
The net outflow rhythm is not continuous, interspersed with two days of net inflow, which is one of the core reasons for the recent repeated 'drawing doors' in Bitcoin prices.
If the daily net outflow can present a continuous, rhythmic contraction trend, it will provide important support for a reversal in Bitcoin prices.
1.3 Off-market premium

This week, the off-market premium rates of USDT and USDC have generally maintained a low-level oscillation. This data intuitively reflects that the current market sentiment is relatively low, and the willingness of off-market funds to enter the market for bottom-fishing is insufficient, with market confidence not yet restored.
1.4 ETH supply belt
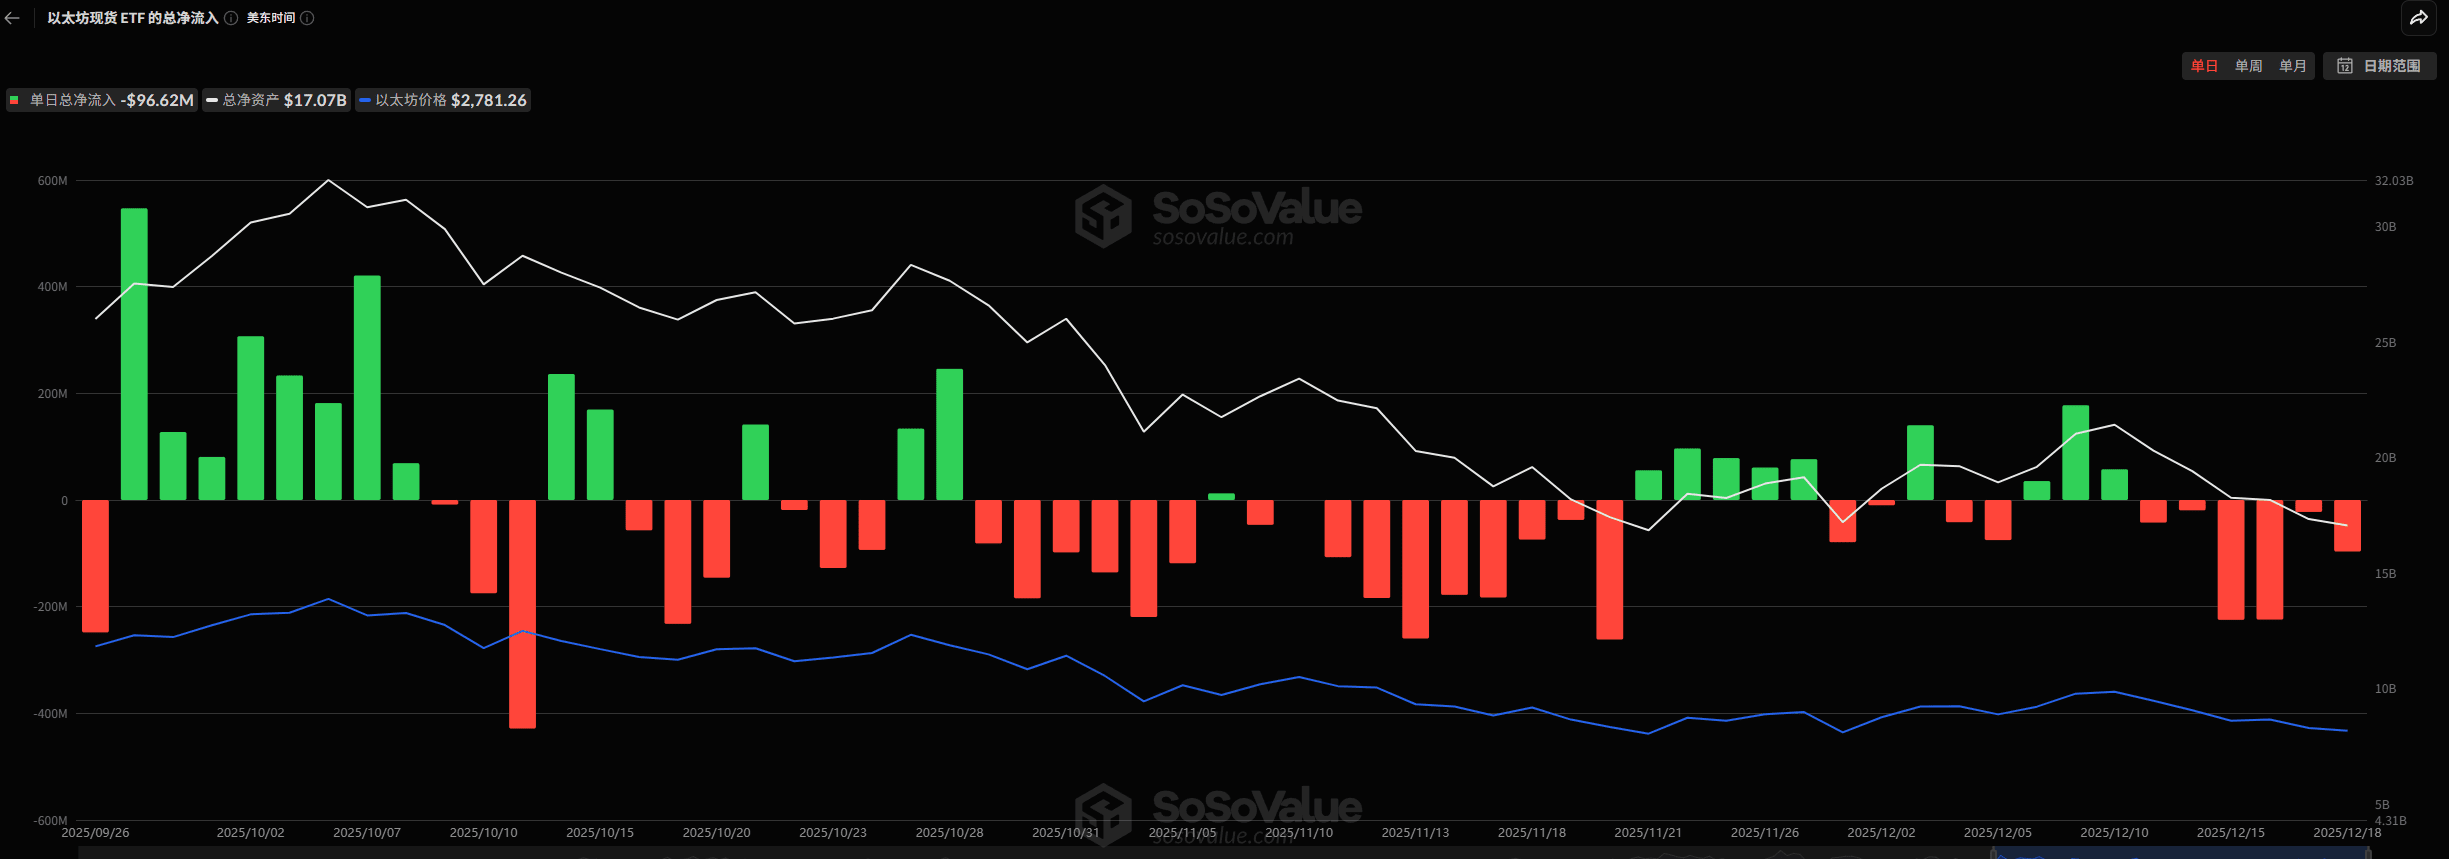
This week, the net outflow scale of Ethereum ETFs has significantly expanded, with a net outflow of $587.5 million for the week, far exceeding Bitcoin ETFs' $289 million net outflow. The weakness in capital flow directly impacts the price, with Ethereum's performance this week clearly weaker than Bitcoin's. From the perspective of daily capital flow, there are no signs of a sustained contraction in the net outflow of Ethereum ETFs, and subsequent monitoring of capital flow changes is needed.
1.5 Bitcoin microstrategy purchase
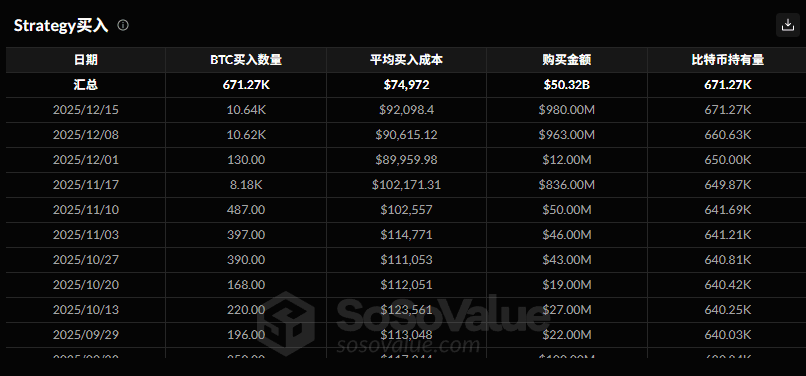
This week, the market welcomed important bullish signals: Microstrategy invested $980 million on December 15, at an average cost of $92,098.4, increasing its holdings by 10,640 BTC. As of now, Microstrategy holds a total of 671.27 thousand BTC, accounting for 3.362% of the total Bitcoin supply, and the continuous accumulation by giants provides expectations for market bottom support.
2. Changes in medium-term data affecting market trends this week
2.1 Holding address holding ratio and URPD
From the perspective of Bitcoin holding address structure, this week different scale addresses showed divergent trends:
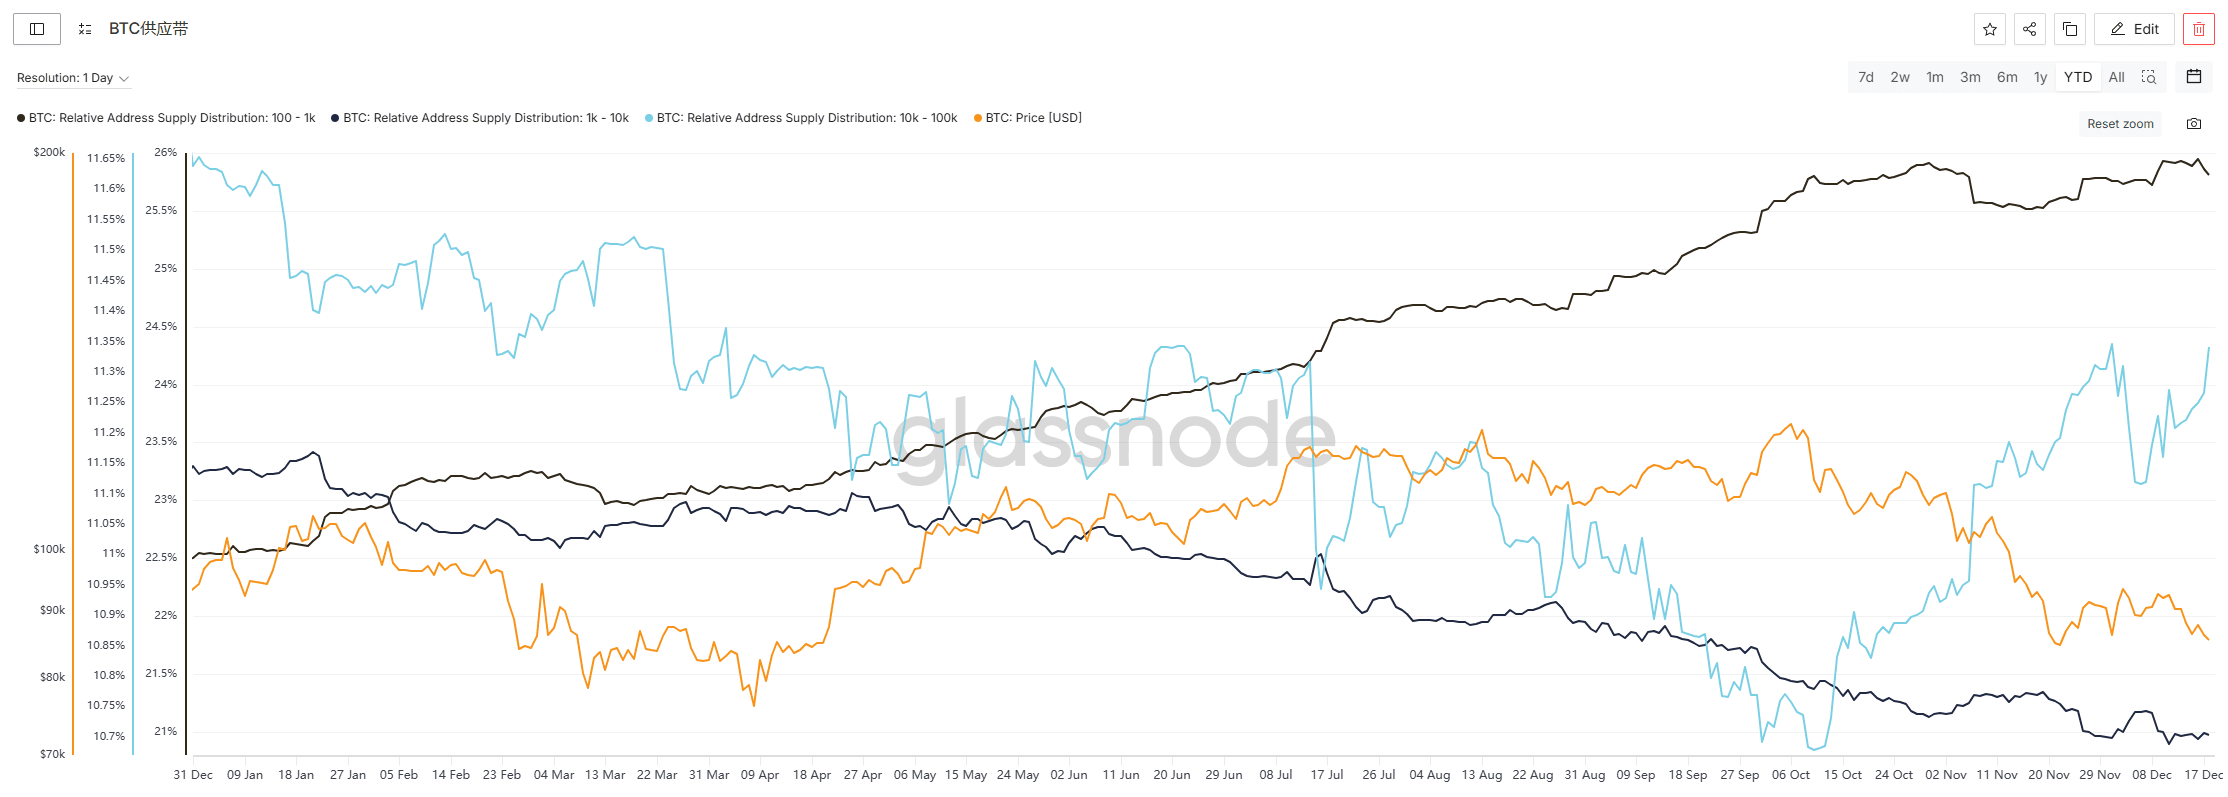
100-1K BTC addresses: The holding ratio dropped from 25.946% to 25.813%, showing slight signs of reduction, but the reduction is limited and needs to be observed continuously.
10K-100K BTC addresses: The holding ratio increased from 11.116% to 11.341%, showing a continuous accumulation trend, with significant signals of large capital layout.
1K-10K BTC addresses: The holding ratio has no significant trend changes, maintaining a bottom oscillation.
From the analysis of Bitcoin's chip structure, this week's chip migration characteristics are clear:
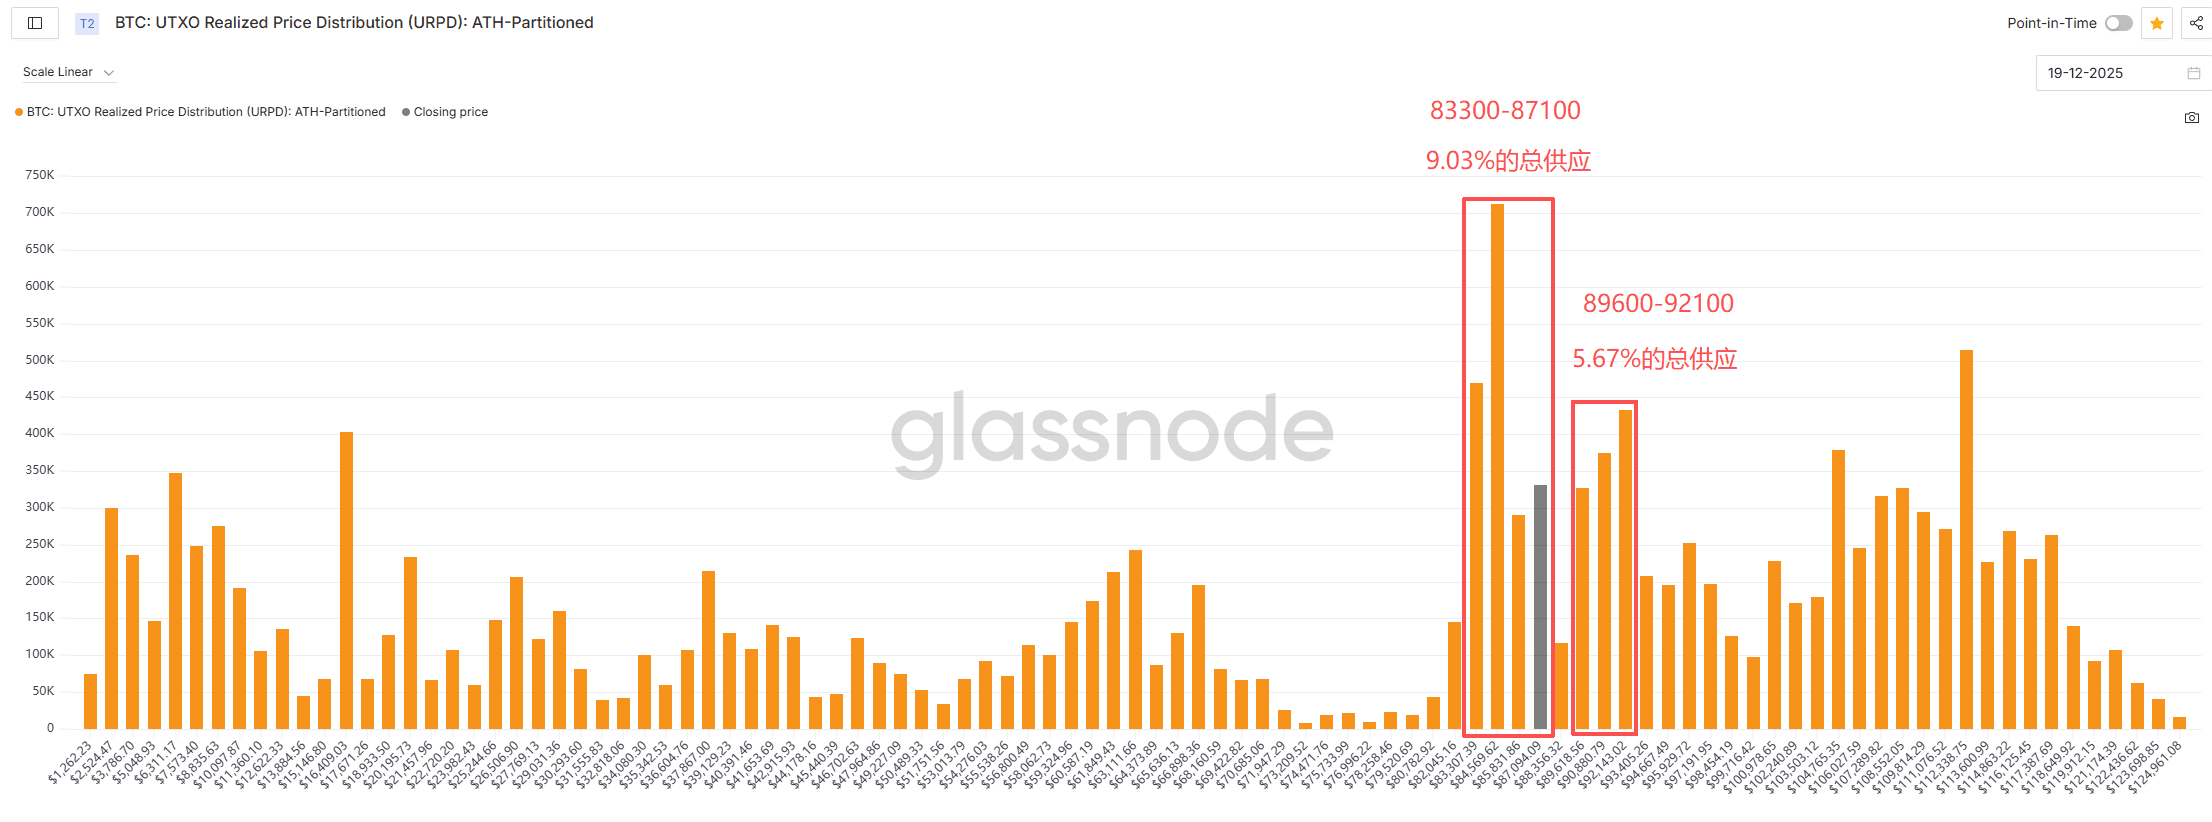
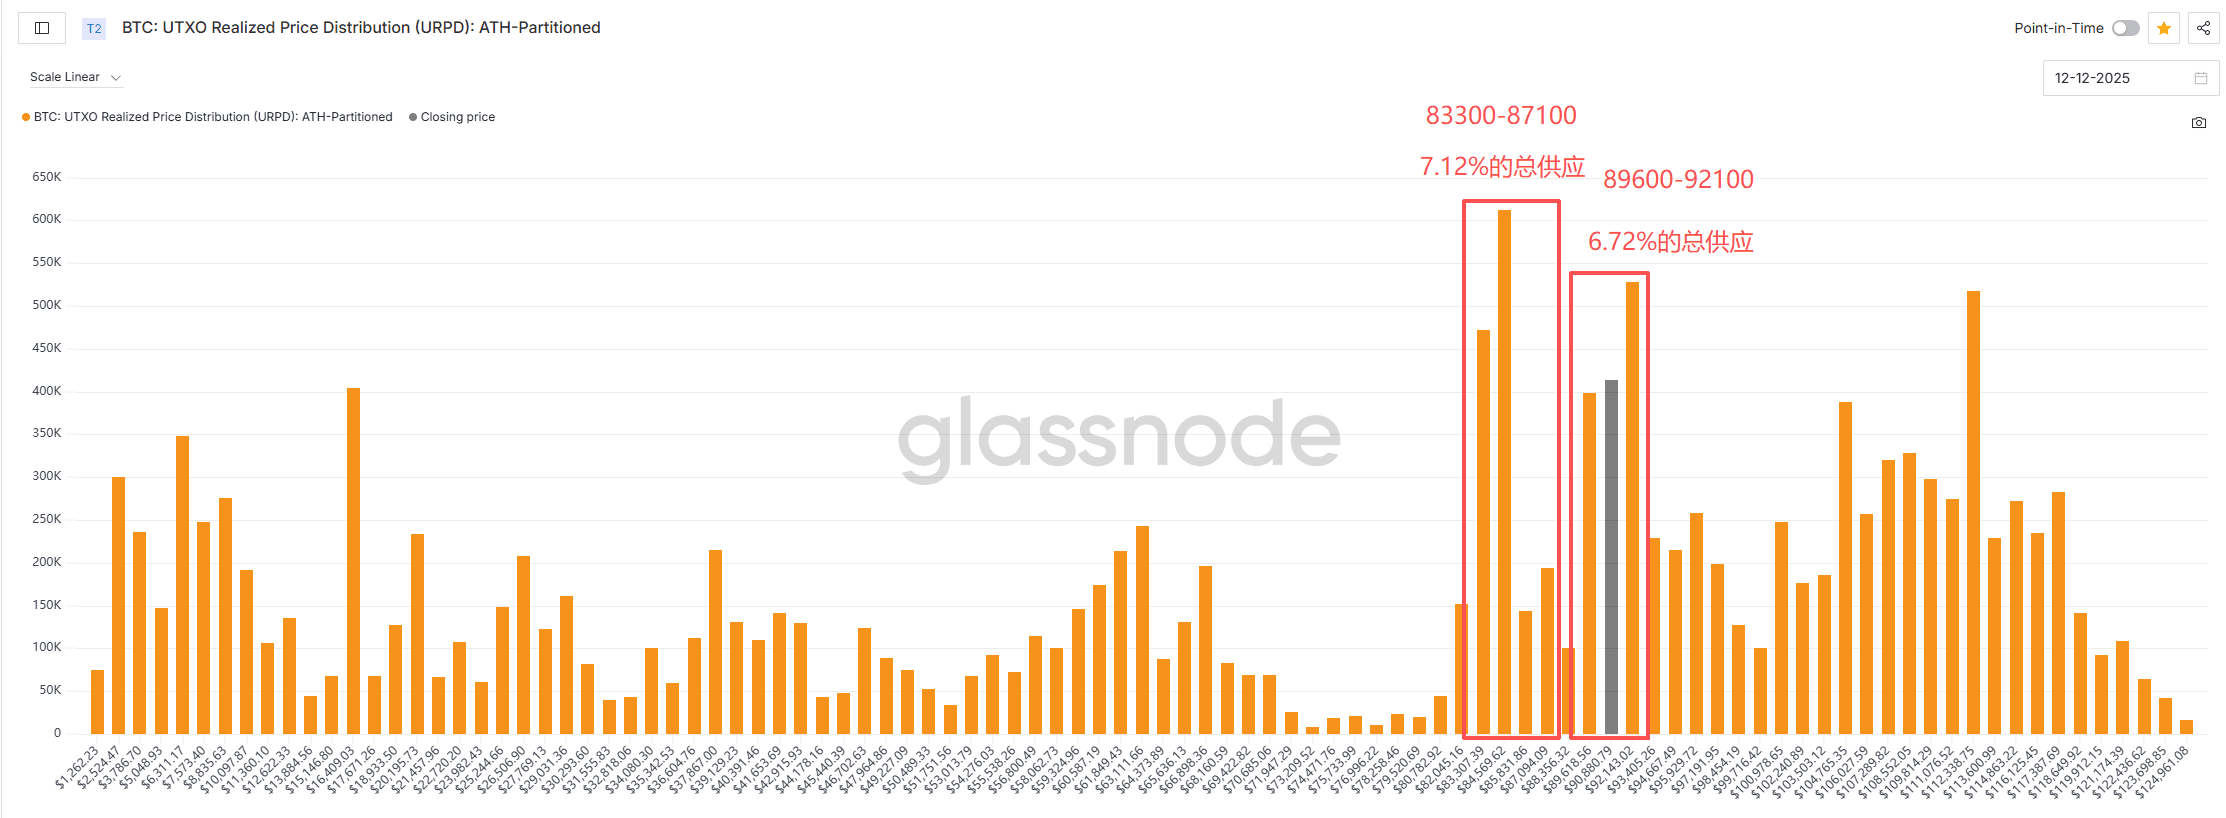
Upper range 89600-92100 USD chip concentration area: The chip ratio decreased from 6.72% to 5.67%, a reduction of 1.05%, with some selling pressure released in this range;
Lower range 83300-87100 USD chip concentration area: The chip ratio increased from 7.12% to 9.03%, an increase of 1.91%, with strong buying support.
Although the loosening of upper chips caused a short-term retreat, the buying power of the support zone below effectively offset the selling pressure, providing a basis for the market's stage stabilization.
3. Altcoin market analysis
This week, the altcoin market underwent a comprehensive adjustment, with earlier hotspots retreating, intensifying existing capital competition, and overall presenting a 'general decline' pattern. This section will disassemble the current state of the altcoin market from three major dimensions: market overview, secondary market trends, and primary market data.
3.1 Market overview
3.1.1 Altcoin market capitalization
This Friday, TOTAL3 (total market capitalization excluding BTC and ETH) reported $806.6 billion, a month-on-month decrease of 7.3%. This week, Bitcoin followed the fluctuations of the US stock market and fell, with the pressure level at $94,000 being difficult to break through, compounded by concerns from Broadcom's earnings report falling short of expectations in the AI sector, putting overall risk assets under pressure. The current market is in a weak oscillation range, with insufficient incremental capital inflow and increased complexity in existing game dynamics.
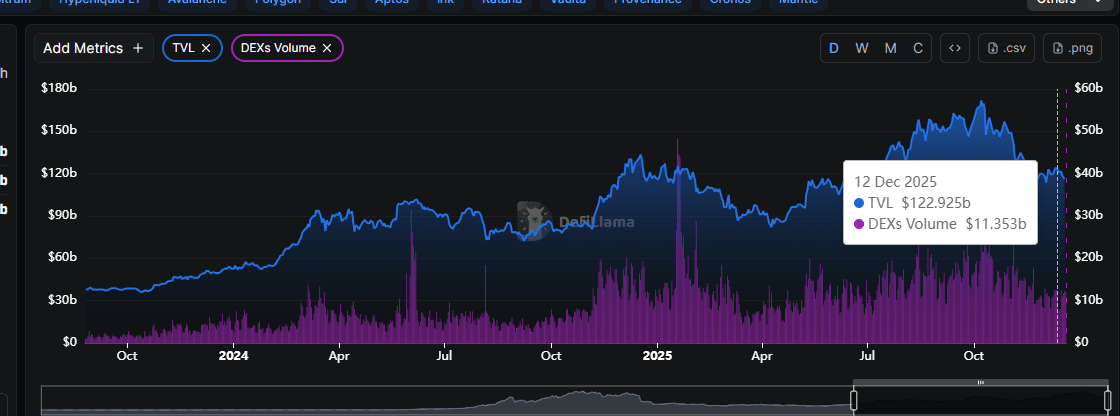
3.1.2 Overview of on-chain TVL
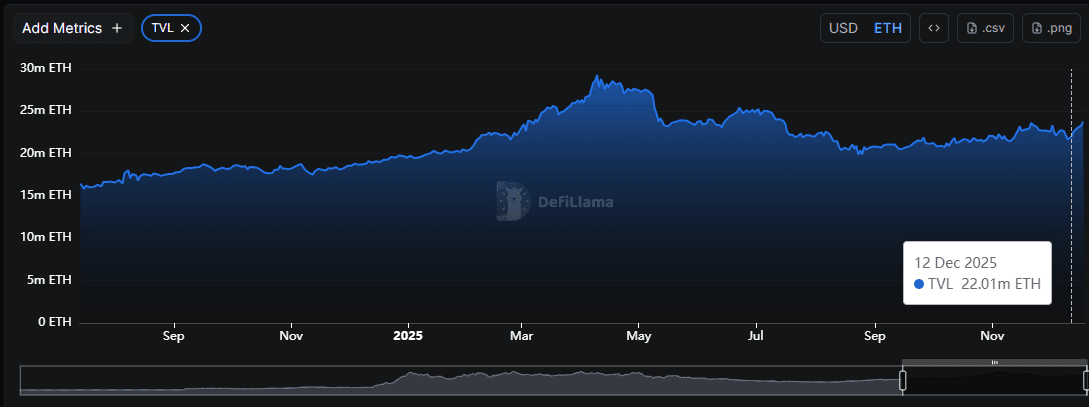
Total on-chain TVL (Total Locked Value) reported $116 billion, a month-on-month decrease of 6.15%. The TVL trend is highly correlated with coin prices, both declining simultaneously. It is worth noting that Ethereum's pledge volume slightly increased this week, with a positive mid-term trend.
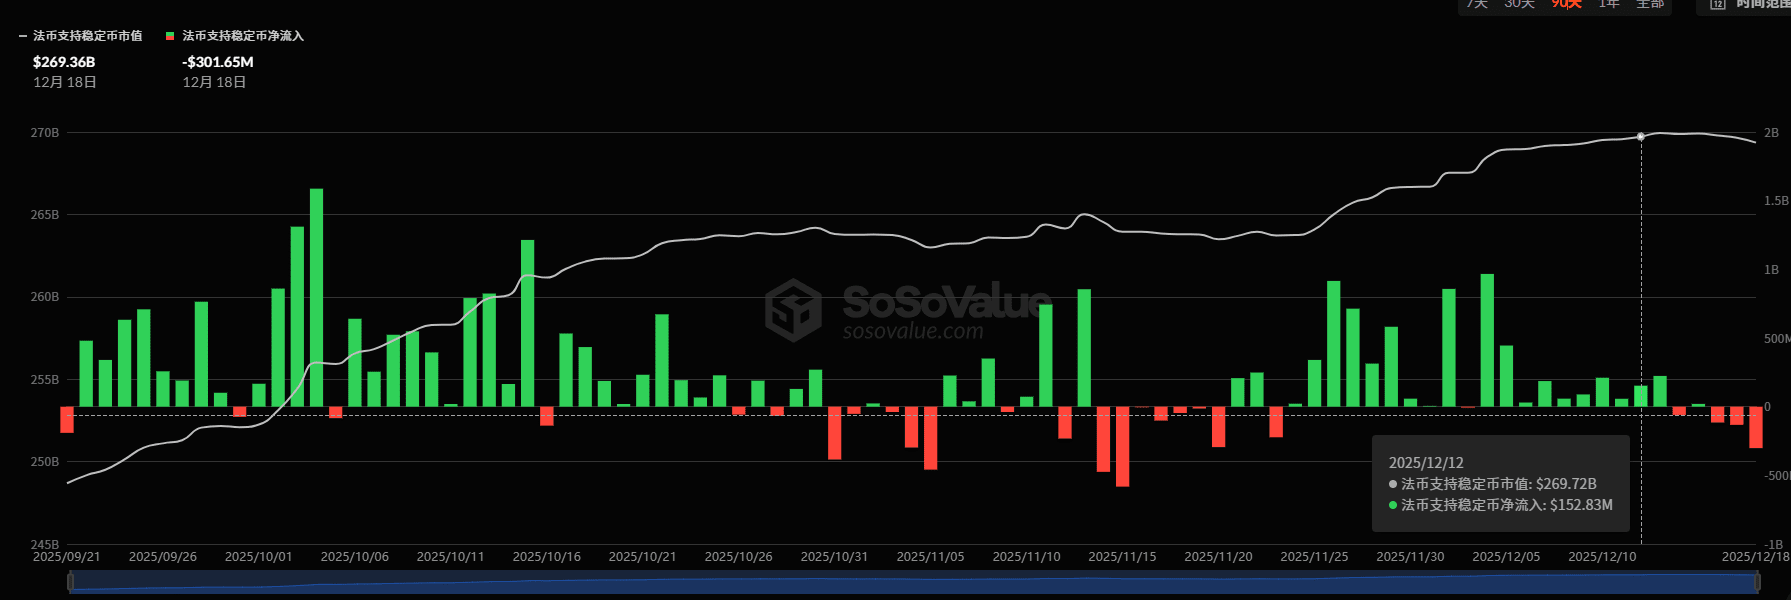
3.1.3 Stablecoin market capitalization and exchange reserves
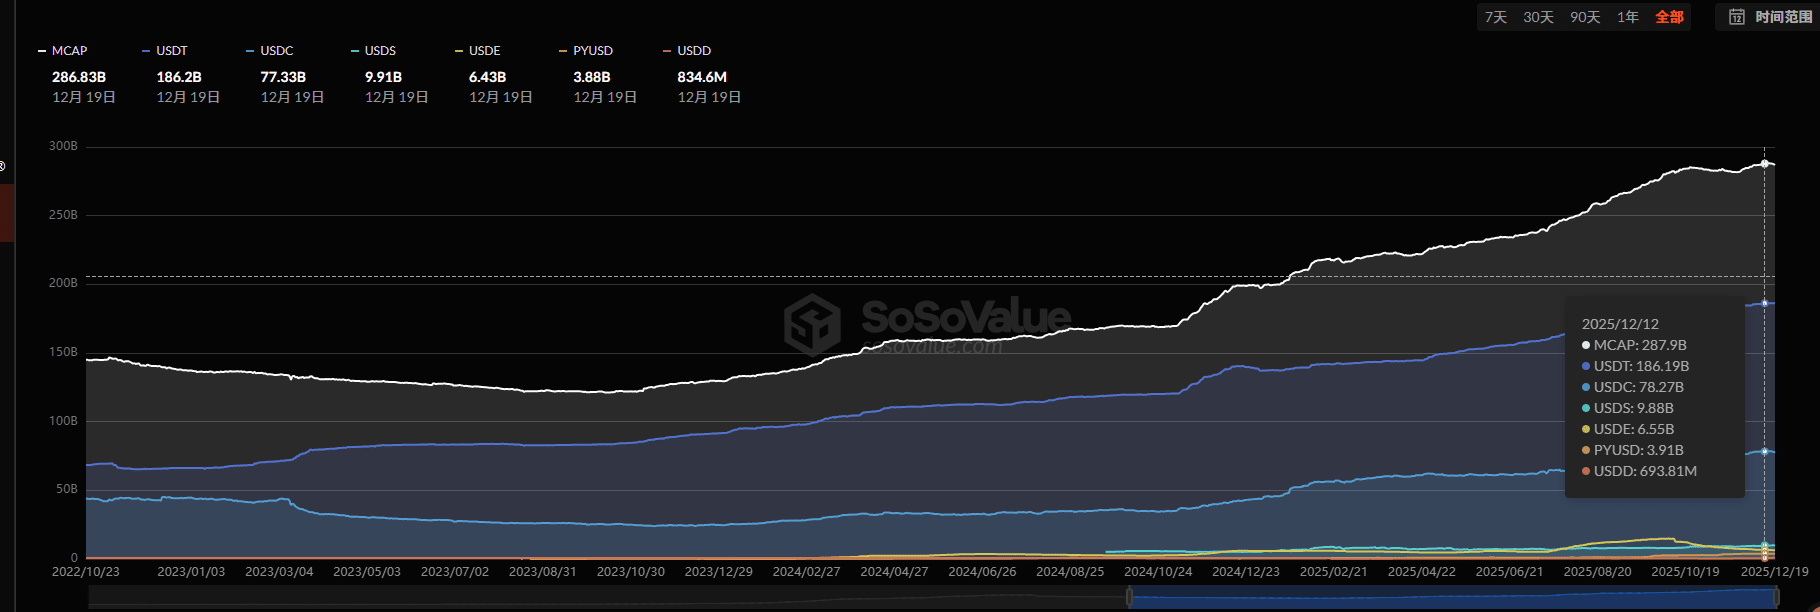
Total stablecoin market capitalization: $286.8 billion, a month-on-month decrease of 0.38%, with fiat-supported stablecoins net outflowing $1.1 billion. The scale of stablecoins shrinks along with the market decline. Before macro stability is clearly established, the correlation between stablecoin issuance and price fluctuations is strong, and sustainability is weak.
Exchange stablecoin balances: significantly decreased this week. Bitcoin's recent rebound did not coincide with stablecoin inflows, reflecting that the market has not truly stabilized.
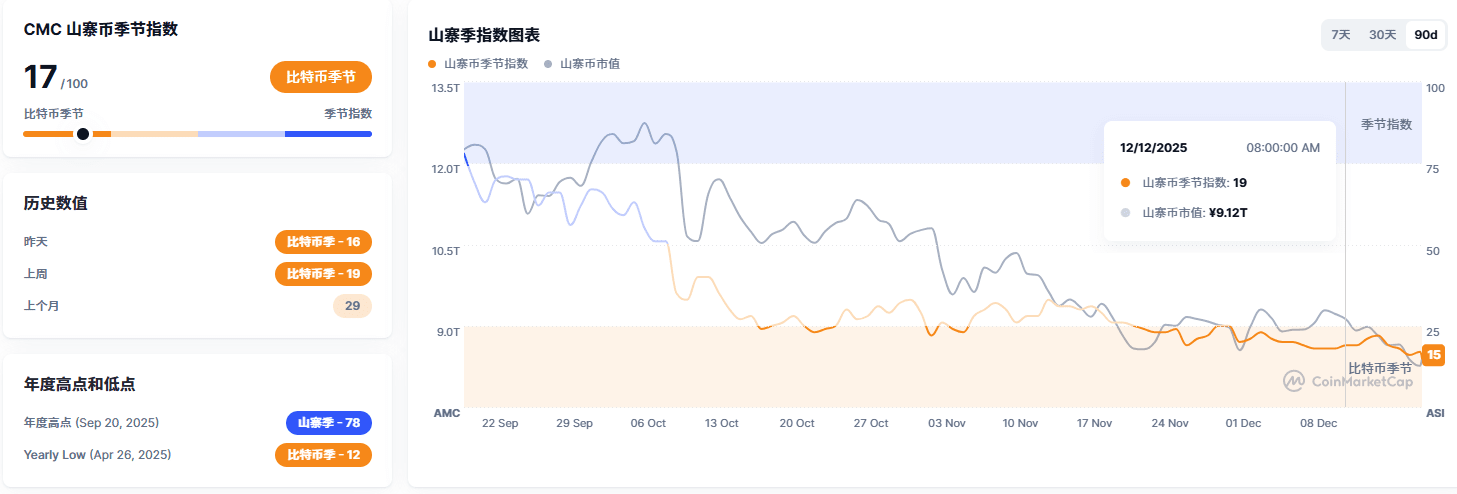
3.1.4 Altcoin index
This Friday, the altcoin index reported 17, lower than last week, maintaining a low-level oscillation. Compared to Bitcoin, altcoin sentiment shows marginal signs of weakening.
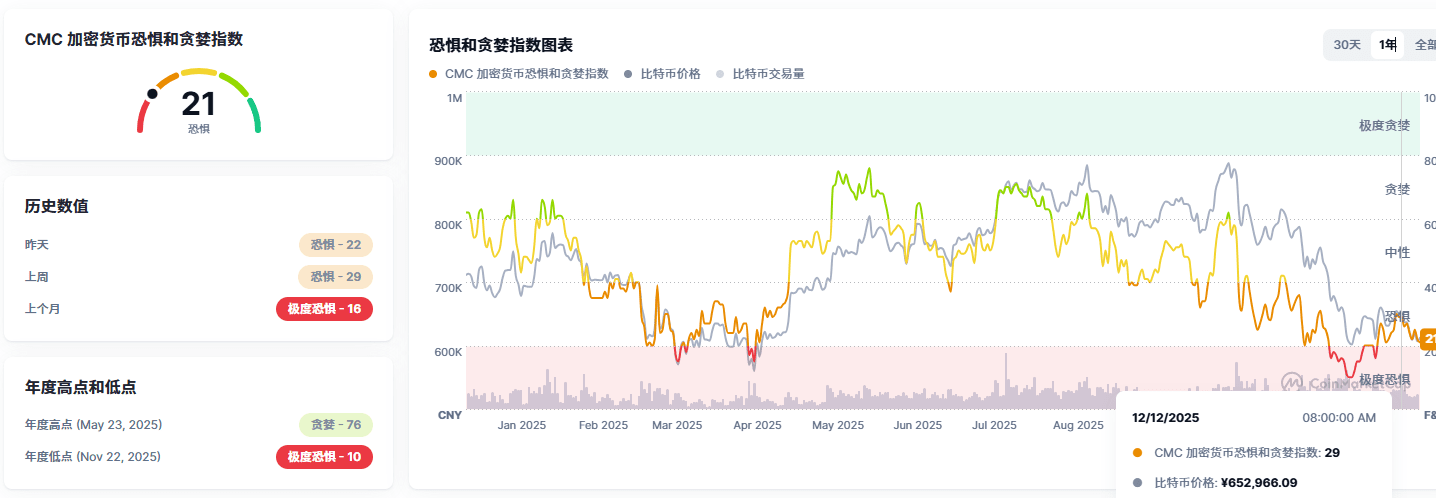
3.1.5 Market sentiment
The market sentiment index reported 21 on Friday, significantly down from last week. After a brief rebound earlier, market sentiment has entered a retreat period.
3.1.6 Altcoin overview
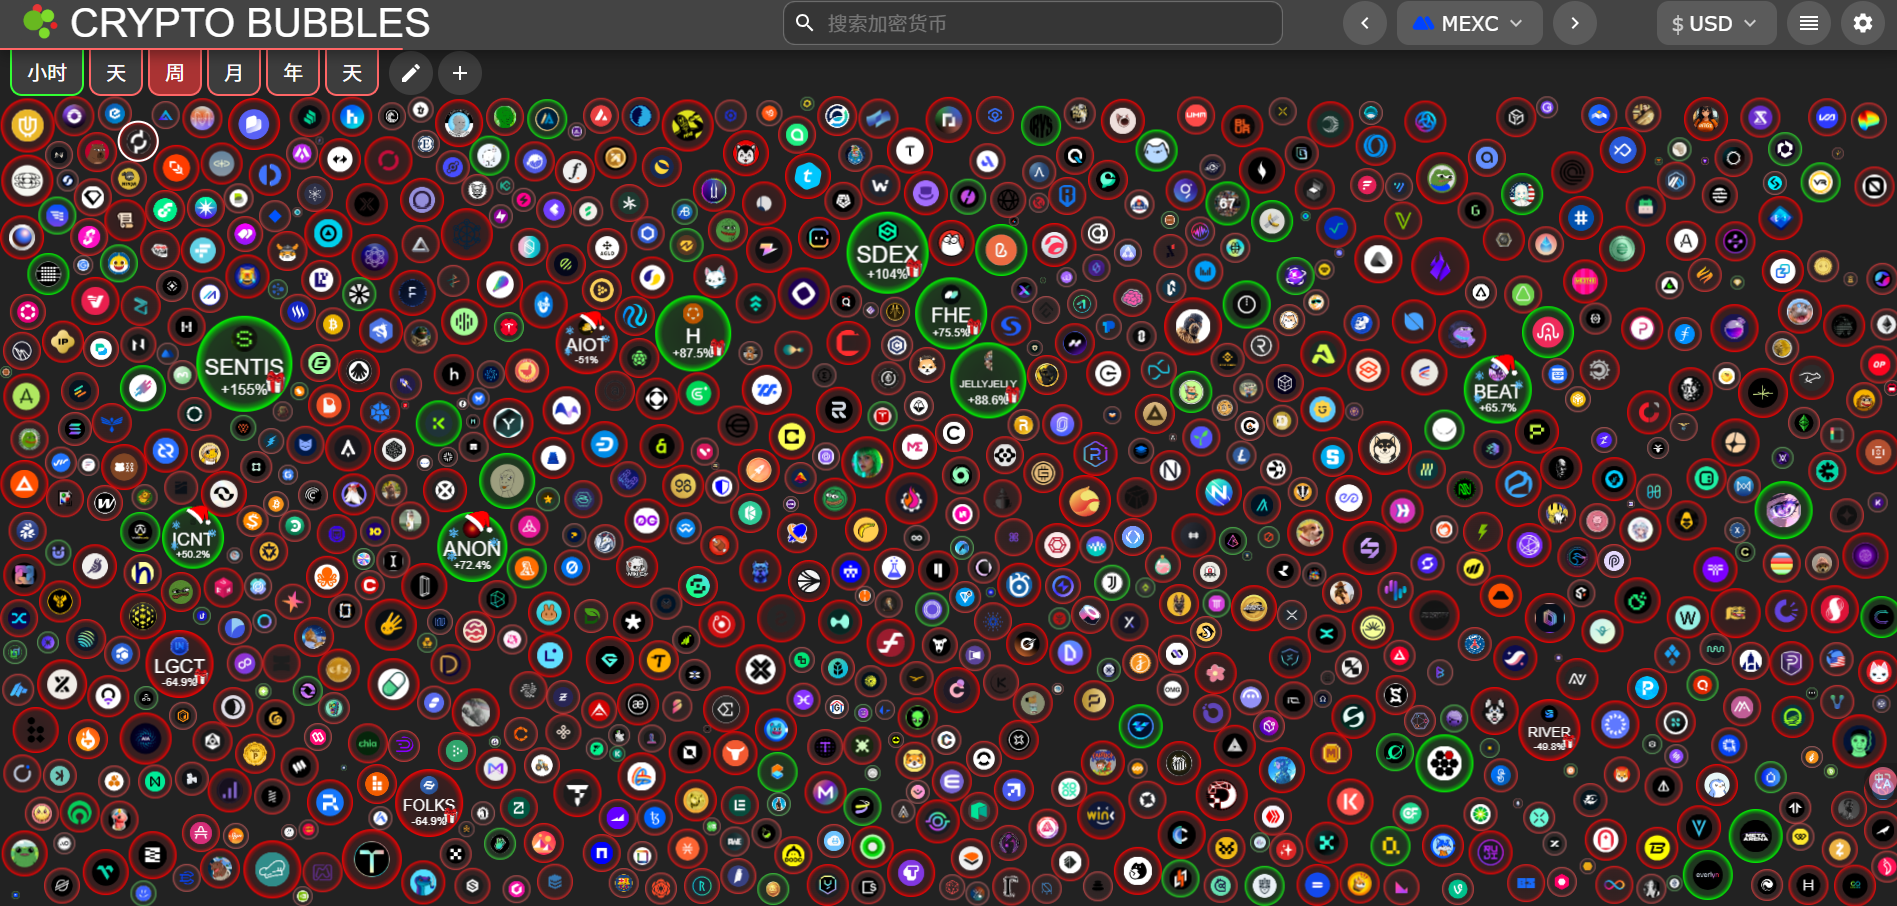
This week, the altcoin market experienced a unilateral decline. The momentum of earlier hotspot speculation has been exhausted, lacking new hotspots to drive market sentiment, compounded by the impact of large market fluctuations, leading investors to have a strong willingness to cash out. In terms of market performance, only a few small-cap tokens like Swarm and ACT rose against the trend, while all other tokens fell. The current market has entered a retreat phase, and appropriate cash positions or light positions for observation may be the optimal strategy.
This week, the topping out indicators have not issued warning signals, but potential risks must be heeded: the holding ratio indicator for short-term holders of BTC has significantly increased and is about to reach the warning threshold, which may further exacerbate short-term market volatility.
3.1.9 Altcoin popularity
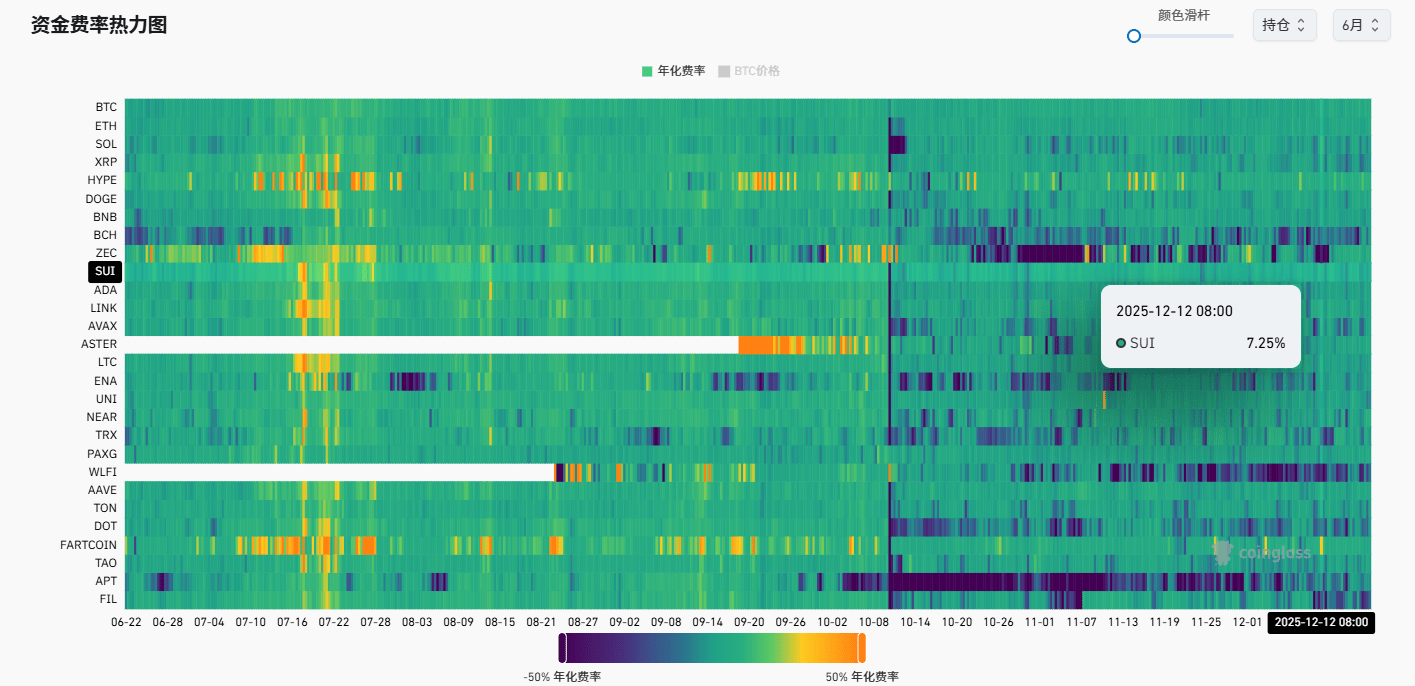
From the perspective of capital rates, most altcoins maintained negative rates this week, reflecting a strong bearish sentiment in the market, but the rates have slightly improved marginally, and pessimistic sentiment has not further deteriorated.
3.2 Secondary market trend analysis
3.2.1 Altcoin strength analysis
BTC market share: reported 65.66% this Friday, a month-on-month increase of 3.99%. During the market downturn, risk-averse sentiment increased, flowing back into mainstream assets like Bitcoin, while altcoins fell significantly more than Bitcoin.
Mainstream altcoin exchange rate trends: SOL/BTC and BNB/BTC rates have significantly underperformed, while ETH/BTC rates remain oscillating. Overall, the mainstream altcoin exchange rates are still in a fluctuating or downward trend.
3.2.2 Market traffic
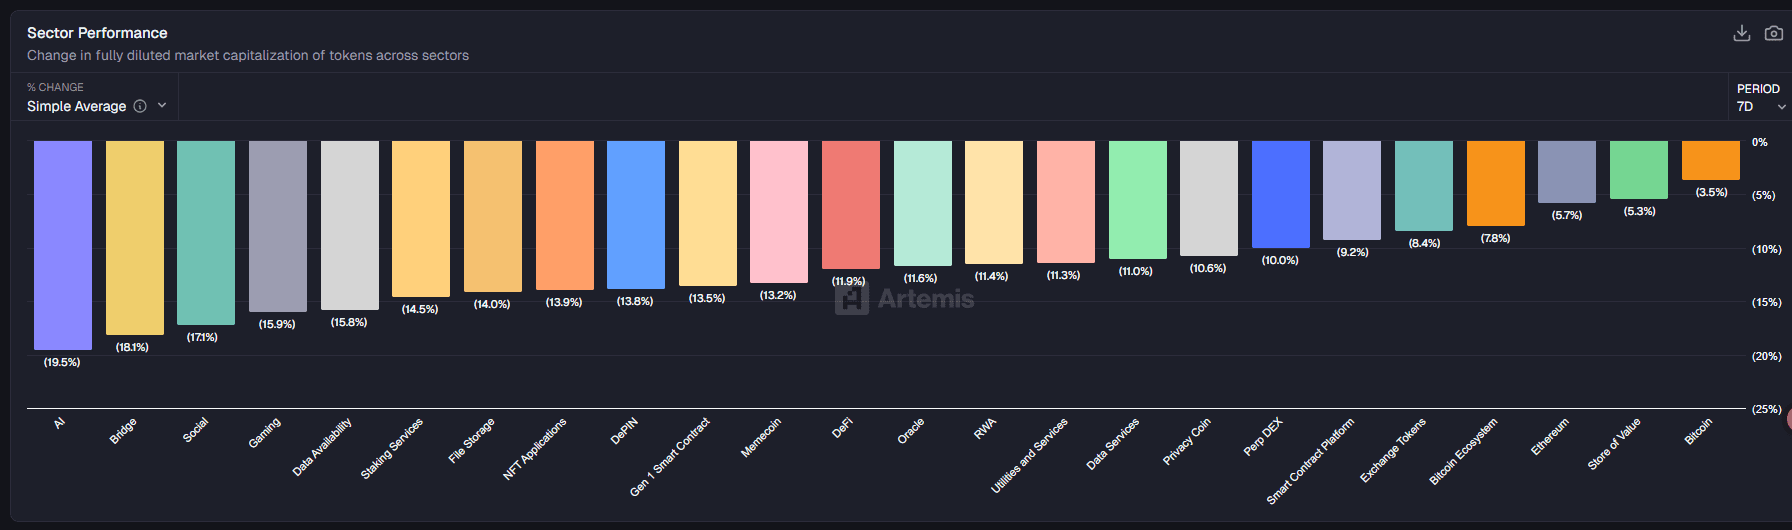
Sector performance: Based on exchange currency sector classification, all sectors fell this week, with the AI sector showing the largest decline, while mainstream coins exhibited stronger resilience compared to altcoins.
Institutional fund movements: This week, BTC and ETH ETFs saw significant outflows; however, institutional actions showed divergence, with institutions like Bitmine continuing to increase their ETH holdings. From the ETH/BTC exchange rate performance, once the market stabilizes, the probability of ETH outperforming the market is high.
3.3 Primary market data analysis
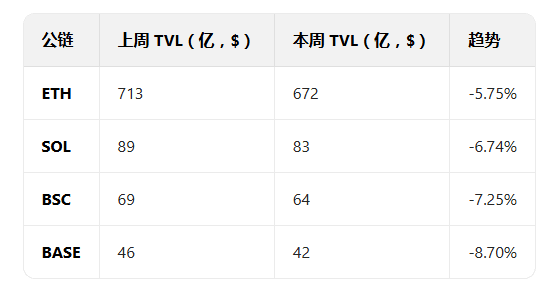
3.3.1 Current status of the four major public chains
This Thursday, the TVL of the four major public chains declined across the board, with on-chain activity decreasing alongside market sentiment.
3.3.2 On-chain data analysis
On-chain asset flow
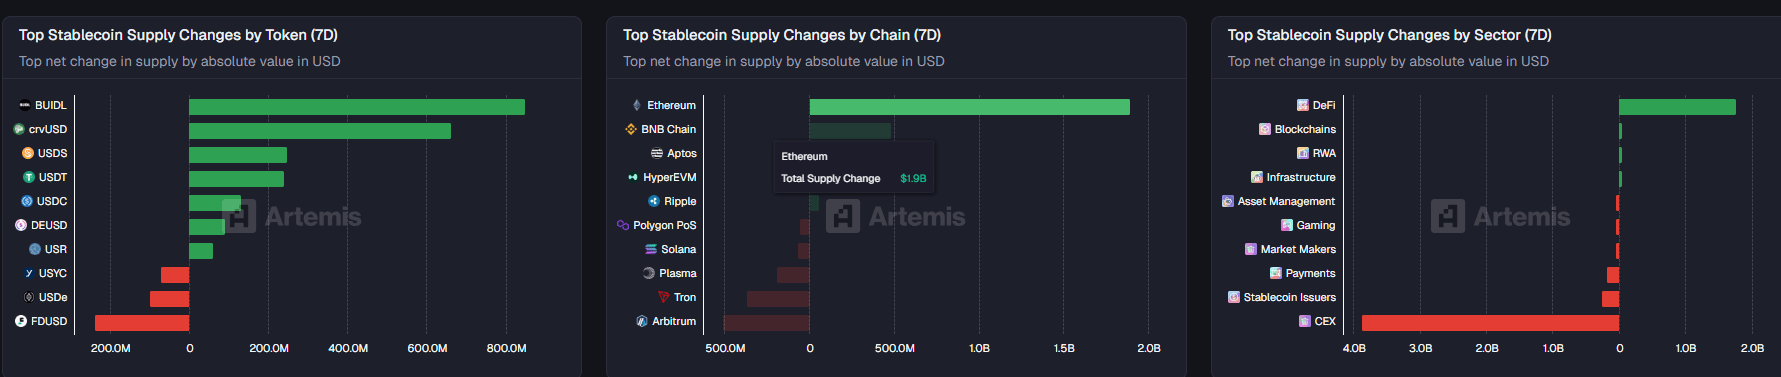
Stablecoin flow: This week, BUIDL issuance scale is the largest, while USDE and FDUSD have significantly outflowed; centralized exchange (CEX) funds continue to flow out significantly, and short-term market sentiment remains low.
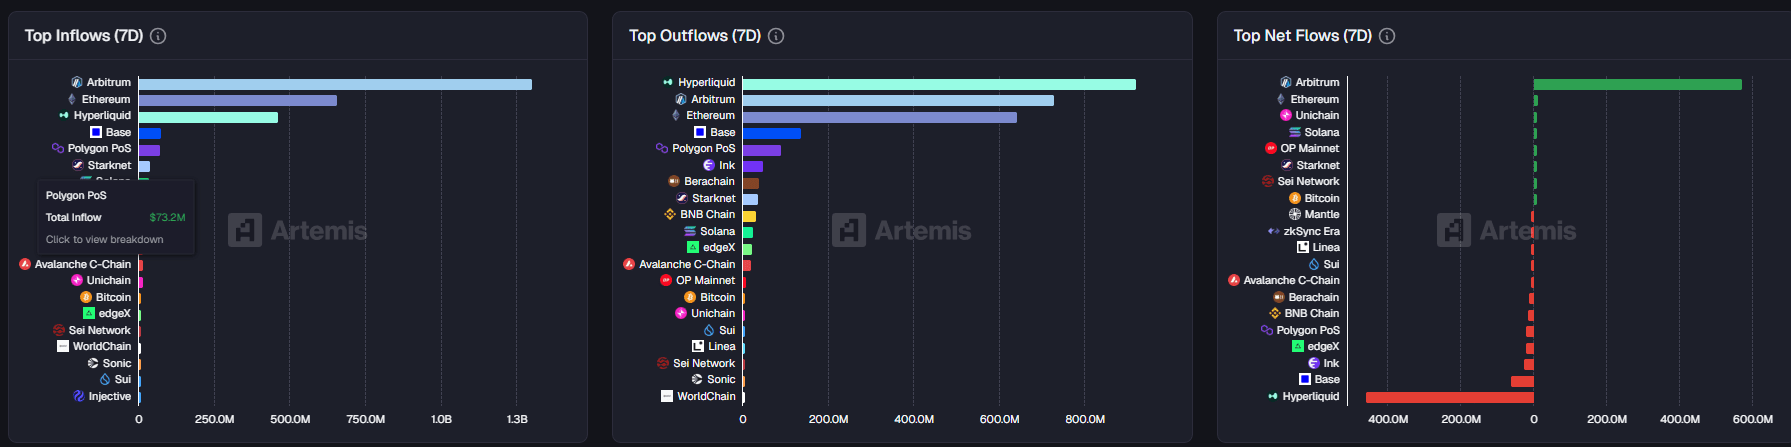
DeFi bridging asset flow: ARB chain has the largest net inflow, while Hype chain has the most outflow. The current market is highly volatile, and the trading difficulty of Hype chain dominated by high-leverage contracts has sharply increased.
On-chain user activity and speculative sentiment
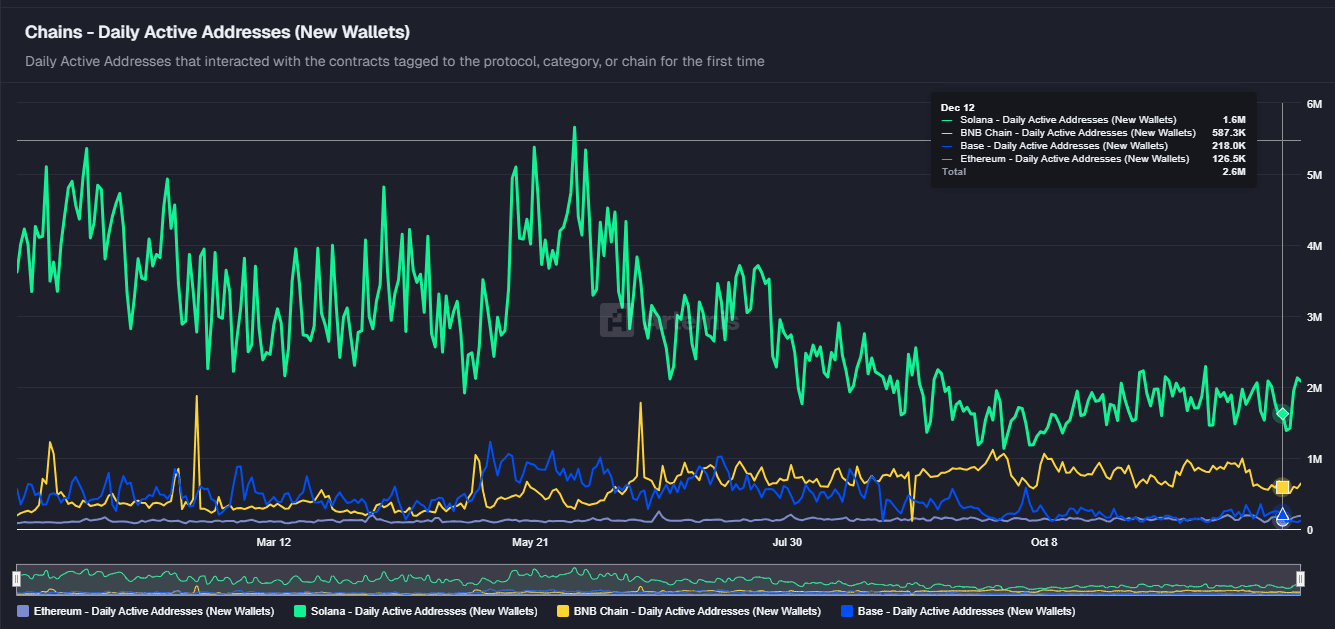
User activity: Overall performance of on-chain activity this week is average, with only marginal improvement, and no signs of a trend reversal.
Speculative sentiment: The protocol revenue, active user count, and transaction volume of decentralized exchanges (DEX) have seen slight increases month-on-month, but overall enthusiasm remains low, with limited growth.
3.3.3 On-chain prosperity index
Comprehensive analysis of the four major public chains' TVL, secondary traffic, user activity, expenses, and revenue across four dimensions (weights are 40%, 20%, 20%, 20%), weighted summary yields this week's on-chain prosperity index:
This week's on-chain prosperity index: 50 (below the rising line)
TVL and DEX data of the four major public chains: 20/40, slightly decreased, scoring 50%;
Secondary traffic reference: 10/20, ETF slightly outflowing, altcoins generally falling, scoring 50%;
User activity: 10/20, this week's activity is relatively poor, scoring 20%;
Expenses and REV: 10/20, income and REV performance stable, ETH relatively strong, scoring 50.
The data in this report is edited and organized by WolfDAO. If you have any questions, please contact us for updates.
Author: WolfDAO


