📊 $DOT

Analyzing DOT based on the chart, RSI, MACD, liquidation maps, and capital flows.
This is not a signal, but a description of the real market picture.
🔎 MARKET FACTS (CURRENTLY)
Price: ~1.82
Market cap: ~3.0 billion $
Volume 24h: ~90 million $
Change over 24h: −1.45%
📉 RSI (various TF)
15m: 67 → local overheating
1h: 51 → neutral
4h: 46 → weakness
24h: 34 → almost oversold
7d: 30 → almost oversold
👉 Short-term rebounds are possible, but the background is weak.
📊 MACD
Short TF — fluctuations around zero
7D MACD — deeply in the negative
👉 Medium-term impulse is bearish.
📈 4H-CHART — WHAT IS IMPORTANT
Price below EMA50 / EMA100 / EMA200
Ichimoku above → pressure is maintained
Bollinger: the market is compressed, sharp movements are possible
Volumes — without a confirmed buyer
📌 Medium-term — down. This is a fact.
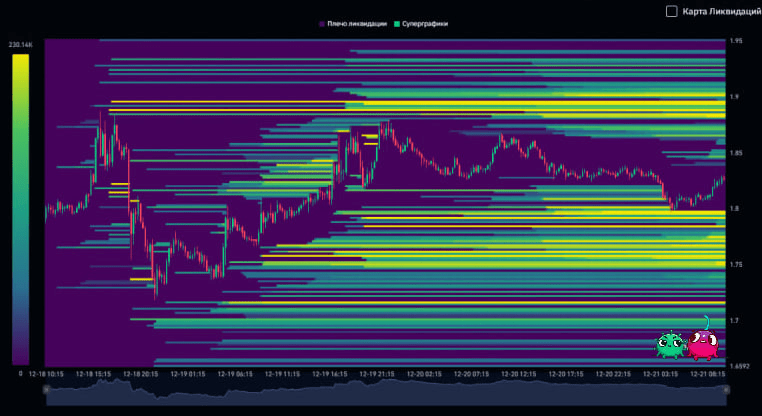
💧 LIQUIDATION MAP
Below the price — liquidity zones
The market has an incentive to make false breakouts
Such zones sometimes provide counter-trend rebounds, but not reversals
💰 FUND FLOWS
Short-term (2–6h): local inflow
1D / 7D / 30D: strong outflow, especially in futures
👉 Money does not systematically enter the market.
📌 OUTPUT ON SCENARIOS
🟢 LONG
Possible only as a short-term rebound
Probability: ~40%
Rebound targets: 1.88–1.91
Long is not basic, easily breaks with one plunge
🔴 SHORT
More logical in structure
Probability: ~45%
Decline targets: 1.80 → 1.78 → 1.72
🔄 FLAT
~15%
Range: 1.80–1.88
Stop runs in both directions
⚠️ KEY
While the price is below EMA50 and Ichimoku — no reversal
Long is only permissible from levels, not 'by market'
Short is logical not at the bottom, but from resistances
In VIP — practical implementation and support.
📌 #strategy #CryptoTrading #Altcoins #CryptoNews
⚡ Strategies: LONG / SHORT, SPOT — how the market moves and where to enter—@INVESTIDEAUA #DOT