After experiencing a week of wide fluctuations, Bitcoin and Ethereum have calmed down over the weekend, but beneath the calm, undercurrents are surging. Bitcoin is battling around the key technical pivot point of 89500 USD, while Ethereum is trying to consolidate its position near 30000 USD. This article will combine the latest macro events, on-chain data, and technical indicators to analyze the key position of the current market and provide clear trading references.
Mentioned in Saturday's article$BTC 89500~90000~90600~91100 nearby area participates in a high open, this morning the highest came to the 89600 line and started to pull back, just also arrived near 87850.$ETH Let everyone short around 3020~3060~3080. This morning it just reached 3060 and started to pull back, with the average price around 3040, the lowest touching 2966 before rebounding. Currently at the 3010 line, today's strategy continues to focus on shorting, and specific strategies will be found in our market!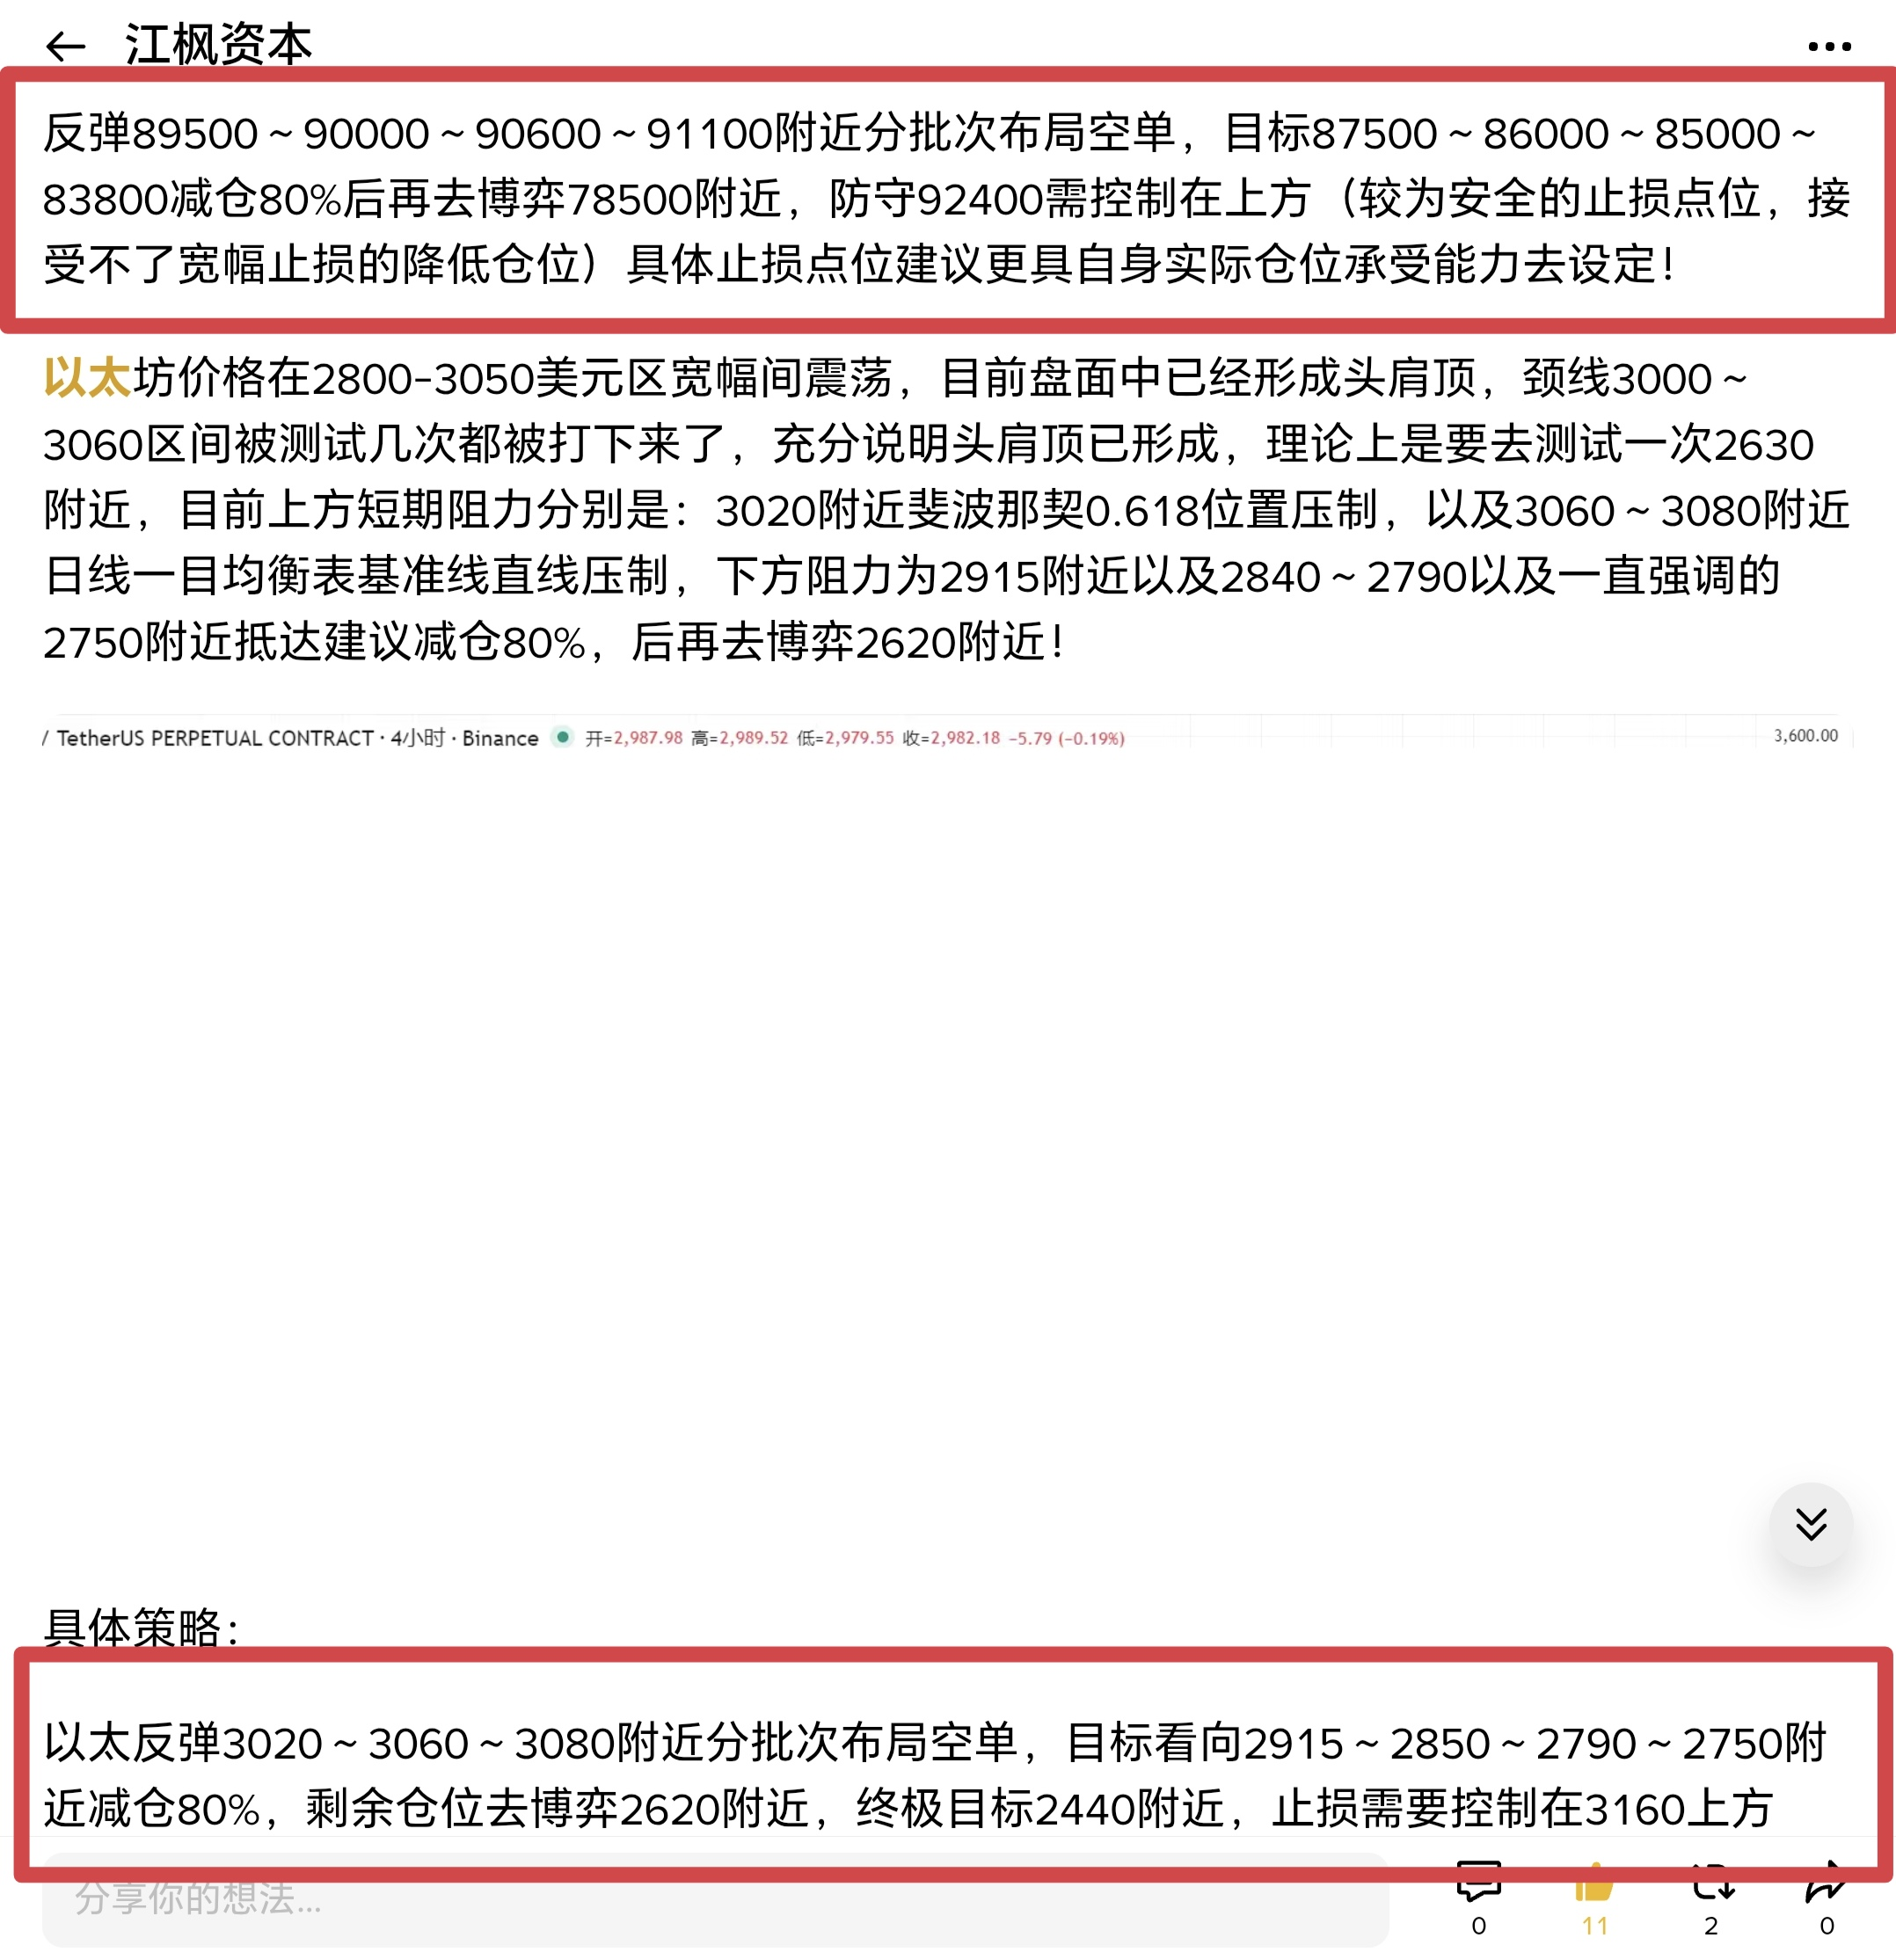
Macroeconomic fundamentals: The tug-of-war between slowing inflation and central bank policies.
Over the past week, the core narrative of the market has revolved around the monetary policies of the two major central banks globally.
US inflation cools: The US November CPI data released on December 18 surprised the market. The data shows that the unadjusted annual inflation rate is 2.7%, which is not only lower than October's 3.0% but also significantly below the expected 3.1%. This data briefly boosted risk assets, pushing Bitcoin towards 90000 dollars, but the price stopped around 89500 and began to continue a significant pullback to around 84400 before rebounding!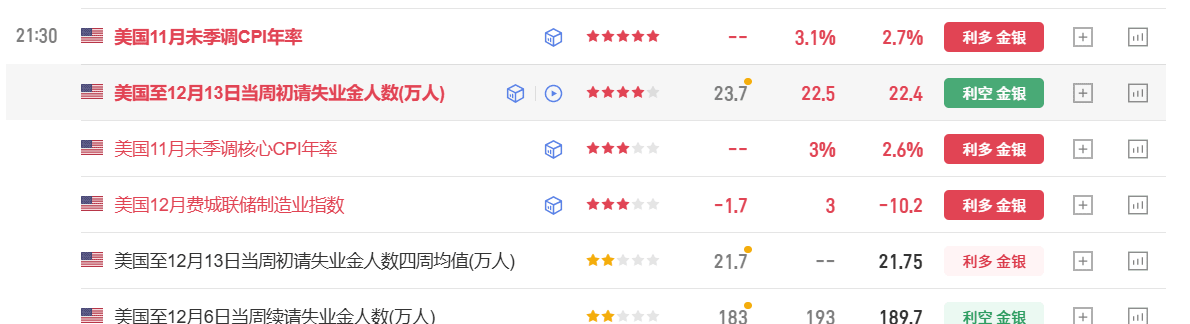
Bank of Japan raises interest rates: However, the market's optimism was quickly interrupted by the Bank of Japan's decision. On December 19, the Bank of Japan announced that it would raise the benchmark interest rate to its highest level in 30 years. Although historical patterns show (for example, significant corrections in Bitcoin after rate hikes in March, July 2024, and January 2025), BOJ interest rate hikes typically put pressure on risk assets, this time it was digested in advance, and the market's reaction was relatively calm. Current support from the Federal Reserve's rate cut intertwines with the Bank of Japan's rate hike and the pressure from next year's ETF sell-off in January, leading the market into a phase dominated by technical factors.
Market sentiment is currently in a state of extreme tension, with the cryptocurrency fear and greed index at 24, in the 'fear' zone.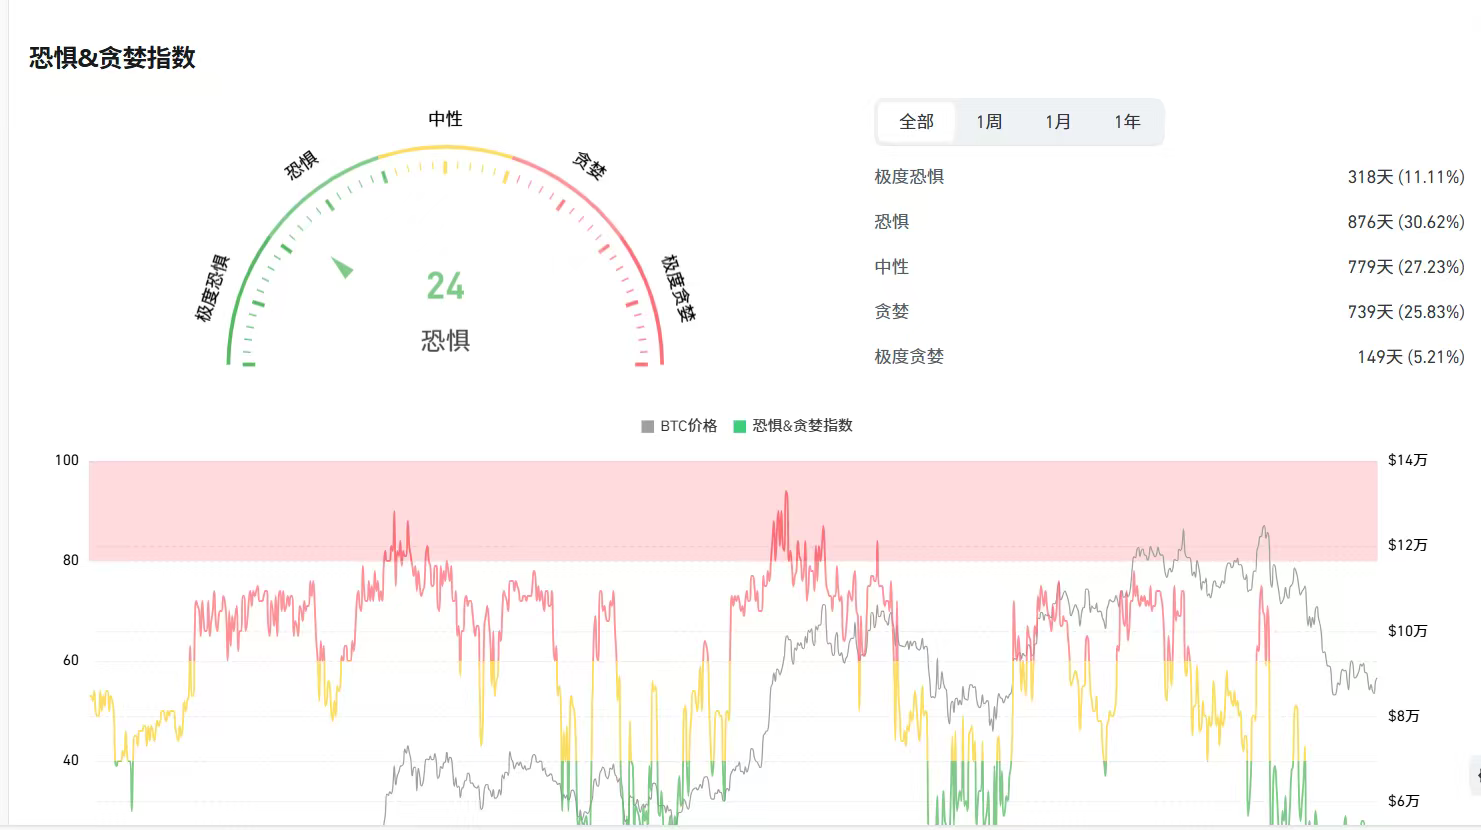
Technical deep analysis: Key level attack and defense battle.
Core bullish-bearish boundary area:
Resistance above: First, it is necessary to break through the dense trading area from 89500 to 91000 dollars. If successfully broken, the next target will point to 94000 dollars. Stronger resistance is found in the range of 99000 to 102000 dollars; only closure above this range on a weekly basis can confirm a true reversal of the downtrend.
Support below: The crucial support nearby is around 87500 to 85600. Once breached, the market may further test the important support area of 83800-78500, potentially even testing the previous low of 74000 dollars.
From the chart, it can be seen that a perfect bearish flag pattern is forming. The main resistance is around 89500~90600, which is a dual resonance of the daily Ichimoku baseline and Fibonacci 0.618. Therefore, this resistance range is worth attempting to short. On Saturday, short at 89500, and based on your own position, reduce your holdings as needed; continue to hold the remaining position!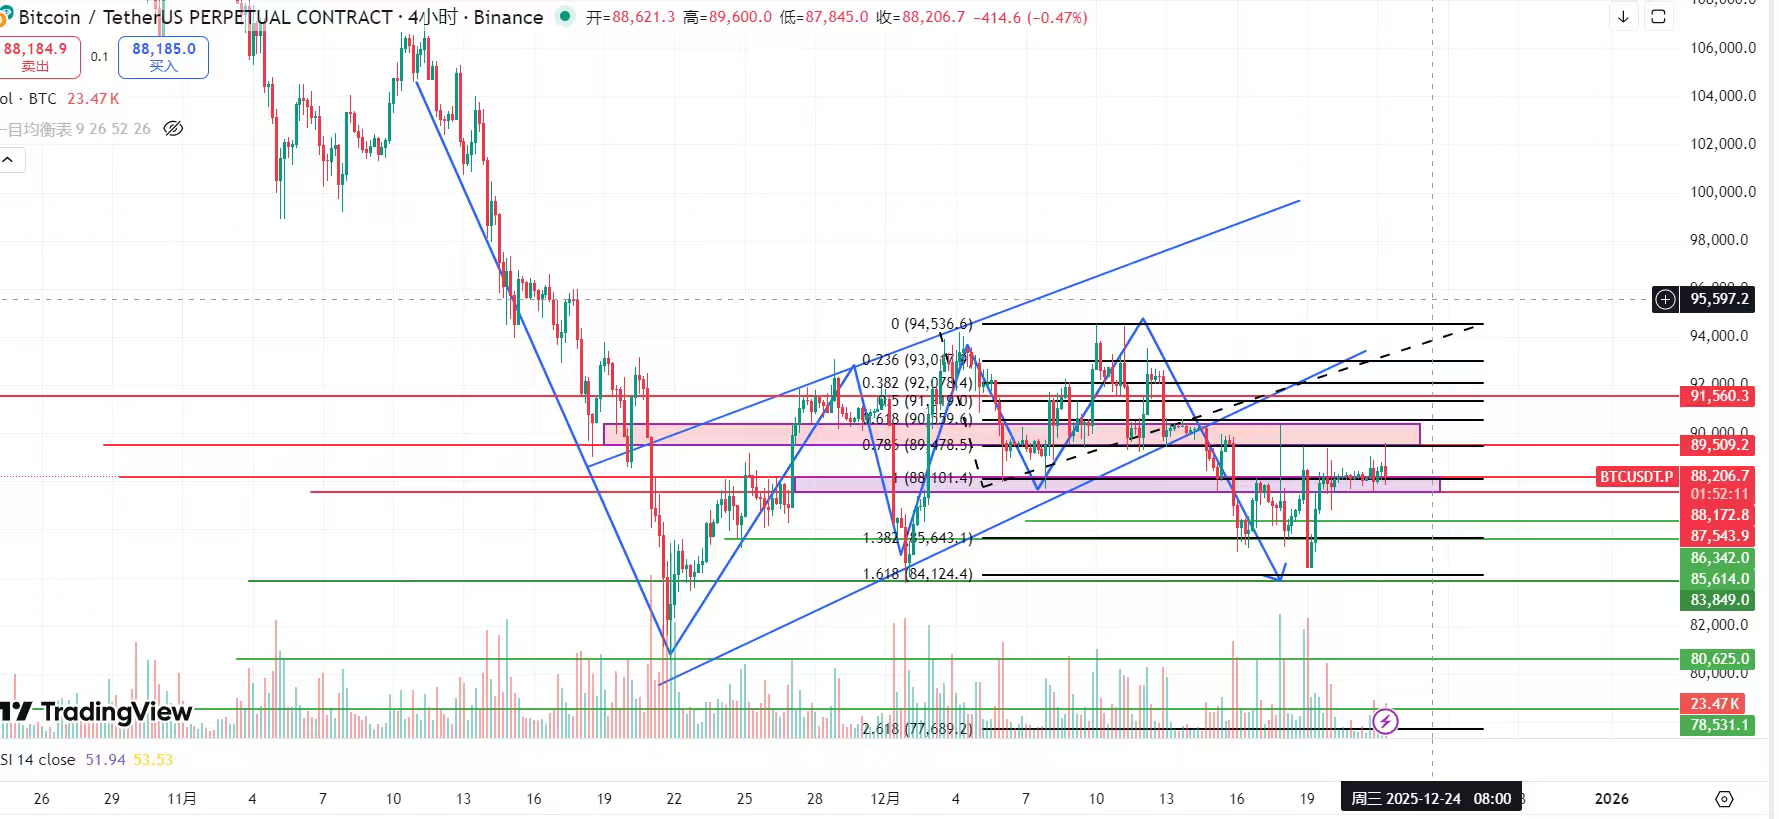
Specific strategy: Participate in shorting Bitcoin around 89500~90600~91500, with a stop loss above 91800, and focus on the previous support range below of 87500~86500~83800~80600~78500.
On-chain data warning: Corresponding to price consolidation is weak on-chain data. Bitcoin's daily active addresses and on-chain trading volume have continued to decline since the November peak. More concerning is that over the past 10 days, more than 17700 BTC have flowed into exchange wallets, which may indicate that some holders are preparing to sell. Today, BlackRock ETF experienced a net outflow of 174 million!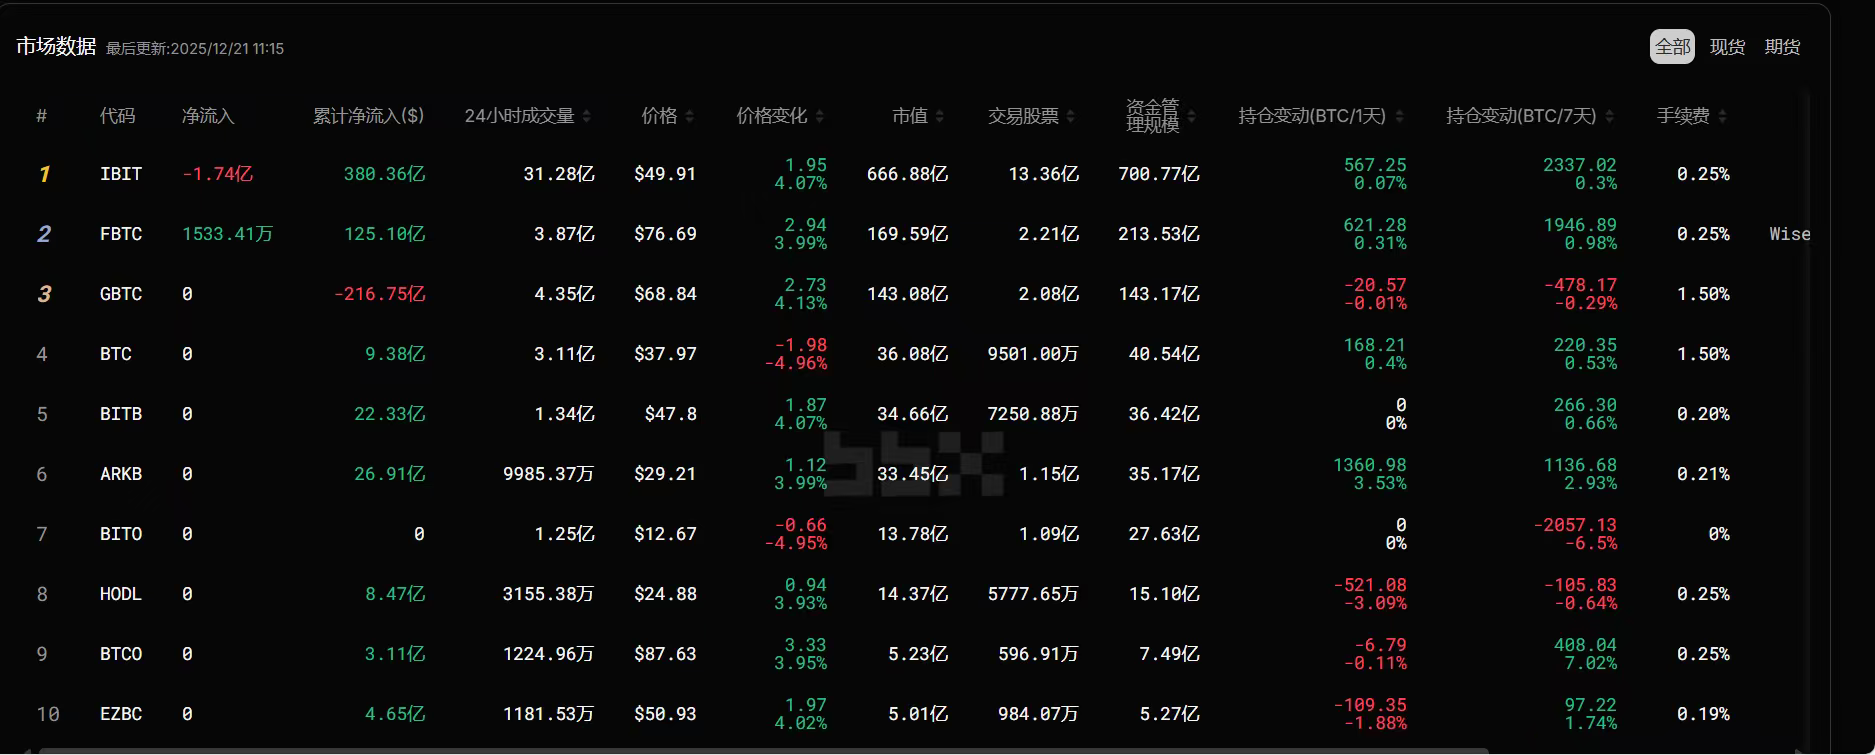
2. Ethereum rebounded to the neckline position of the head and shoulders in the chart at 3060 and then began to pressure down. The resistance above is still clear, focusing on the resistance at 3060 and 3080 baseline, and Fibonacci 0.5 resistance around 3110, as well as 0.618 resistance around 3190. The support below now needs to focus on around 2960, where there is currently a lot of buying support. If this level breaks effectively, continue to look at the ultimate targets of 2915, 2840, and 2750, with the final target at around 2630 for completing the head and shoulders pattern!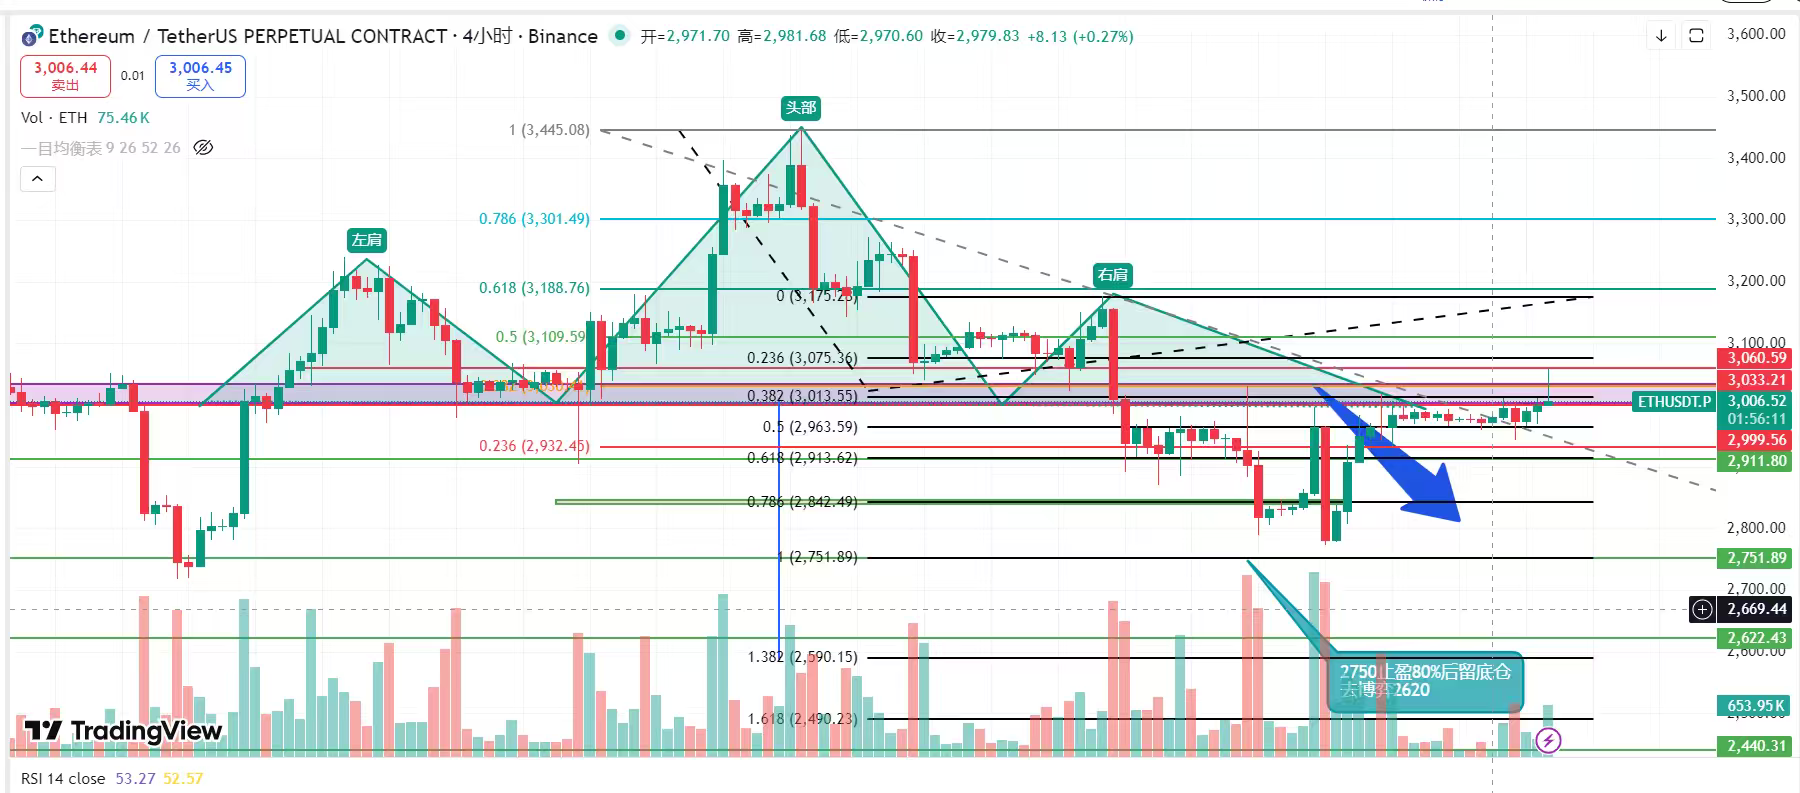
Specific strategy: Participate in shorting Ethereum around 3060~3080~3110, with the stop loss needing to be placed above the left shoulder at 3190. If you cannot accept a wide stop loss, it is recommended to reduce leverage and lower the position! Focus on targets 2960~2915~2840~2750 (reduce positions by 80%) while remaining positions aim for around 2630!
Positive on-chain signals: In stark contrast to weak prices, there is strong on-chain data. Since mid-November, whale addresses holding between 1,000 to 1 million ETH have been continuously accumulating. Additionally, Ethereum's network growth (new address creation) has reached its highest annual level. This combination of 'whale accumulation' and 'record network growth' is often viewed as a strong bottom divergence signal, suggesting everyone strictly manage their positions and ensure proper defense!
The market is experiencing extreme volatility; all trading strategies should be accompanied by strict position management. The above data analysis is merely Jiang Feng's personal interpretation of the chart, with many uncertainties, so please approach it rationally. The market changes rapidly, and profits and losses are self-borne! Everyone is welcome to fill in the invitation code: BTC20242, and join the main chat room to discuss market trends!
Written by: Jiang Feng Capital

