On December 19th, Beijing time, the Bank of Japan (BOJ) announced a 25 basis point interest rate increase, raising the policy rate to 0.75%. Contrary to the market’s previous expectation of a 'tightening followed by a crash', Bitcoin and Ethereum surged strongly after a brief fluctuation, reaching above 88000 and 2980, respectively. This is not merely a market failure, but a result of the transformation of macro narratives, resonance of technical structures, and the psychology of 'bad news fully priced in', indicating that this round of the cryptocurrency market cycle may enter a more complex and prolonged structural bullish phase.
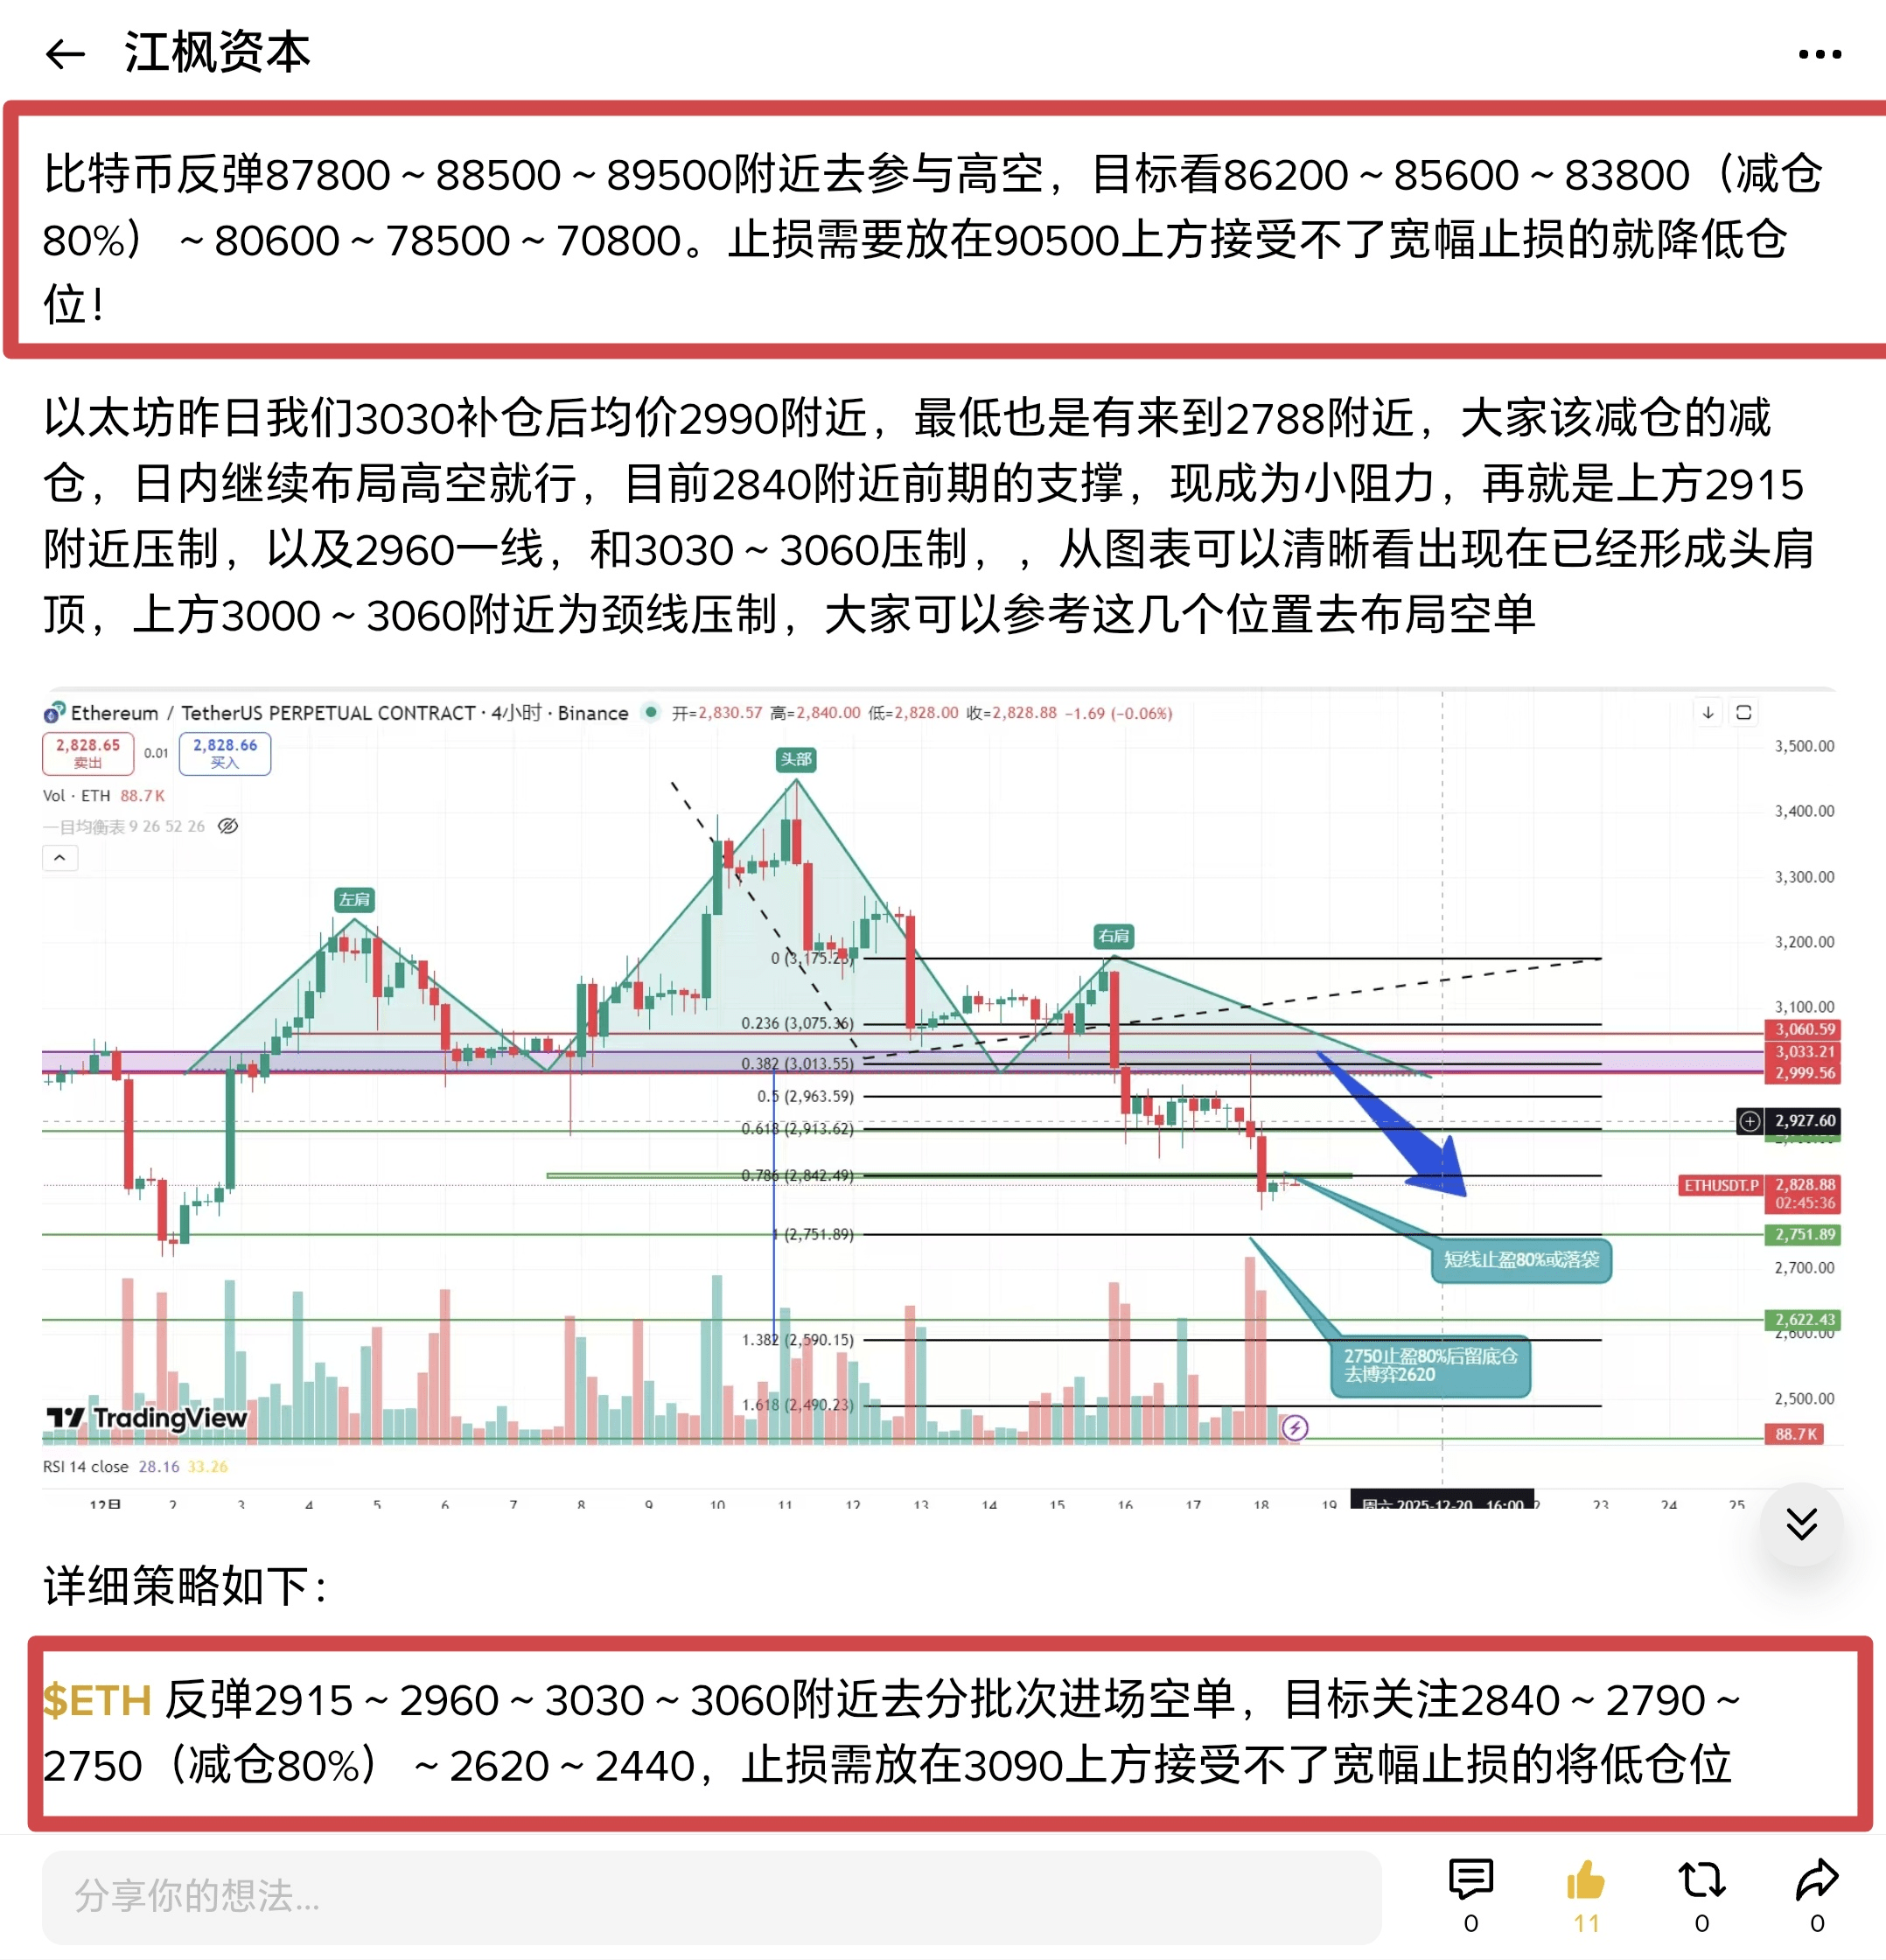
Yesterday, I was delayed by something for a day and the article was not updated. On the 18th, we suggested to short the Bitcoin in the range of 87800~89500, with an average short price around 88600. For Ethereum, short in batches at 2915~2960~3030. In the early hours of the 19th, this was validated, with Bitcoin touching a low of 84400 and Ethereum reaching a low of about 2770. We have achieved our second target of 2790, with a deviation of 20 points from the third target of 2750. So, today’s market has rebounded after hitting the bottom. How should we layout? Let’s first go to the market to find answers!
I. Macroeconomic "shoe drops": Why did the rate hike instead become a catalyst for rising?
The market's reaction to Japan's rate hike has overturned the historical pattern where Bitcoin's average decline exceeded 25% after rate hikes in March, July, and January 2025. The deep reason lies in:
1. Expected to be extremely oversold, negative news has been digested in advance: Before the interest rate meeting, the market had priced the probability of a rate hike at 99%, and pessimism reached its peak. Bitcoin has retraced about 7% from its recent high, reflecting some selling pressure in advance. When the "worst case" lands as expected, market sentiment shifts from worry to relief from the "bad news has been fully priced in."
2. The mismatch between "mild tightening" and "global easing": The Bank of Japan's tightening is slow and has been fully forecasted as a "gentle exit". Meanwhile, the Federal Reserve has entered a rate cut cycle in the second half of 2025. This monetary policy mismatch between Japan and the U.S. weakens the urgency for large-scale unwinding of yen carry trades. The global liquidity environment (measured by M2) has returned to an expansionary track after the Fed's shift, reaching new highs, providing deep support for risk assets.
3. Structural buying support: On-chain data shows that the $85,000 area is a very solid support zone for Bitcoin, with about 400,000 BTC traded in this cost range, highly coinciding with the average holding cost of U.S. spot ETFs. This represents strong institutional reluctance to sell and support, making it difficult for the market to collapse due to a single macro event.
II. Key technical level analysis and long-short trading points
The market rises against macro logic, but it has not escaped the pull of technical factors. The current price is in a wide trading area that determines the short-term direction.
Bitcoin key support zone: $86,000 - $84,000 This is the "lifeline" that determines the bull-bear divide. This area integrates the densely traded area throughout the year and the average market cost on-chain. Once lost, it may open a path to fall towards $80,000 or even the annual low of $74,500.
Bitcoin is currently testing a key five-year trendline resistance, which has historically triggered deep retracements at this position. On the daily chart, the price remains in a potential bearish flag consolidation structure. To reverse this unfavorable structure, bulls must conquer the $92,000 - $94,500 area, where the upper edge of the flag and previous rebound highs are located. The current upper resistances are: around $89,500 ~ $90,000 ~ $90,600 Fibonacci 0.5 and 0.618 suppression, as well as cloud layer linear suppression near $91,100. Short-term suppression is around the current price of $88,500, and an effective breakthrough at the bottom of the cloud layer will likely test the upper resistance zone. Conversely, breaking down around $87,500 and the $86,000 - $85,000 area will continue to look towards $83,800 - $80,600 - $78,500!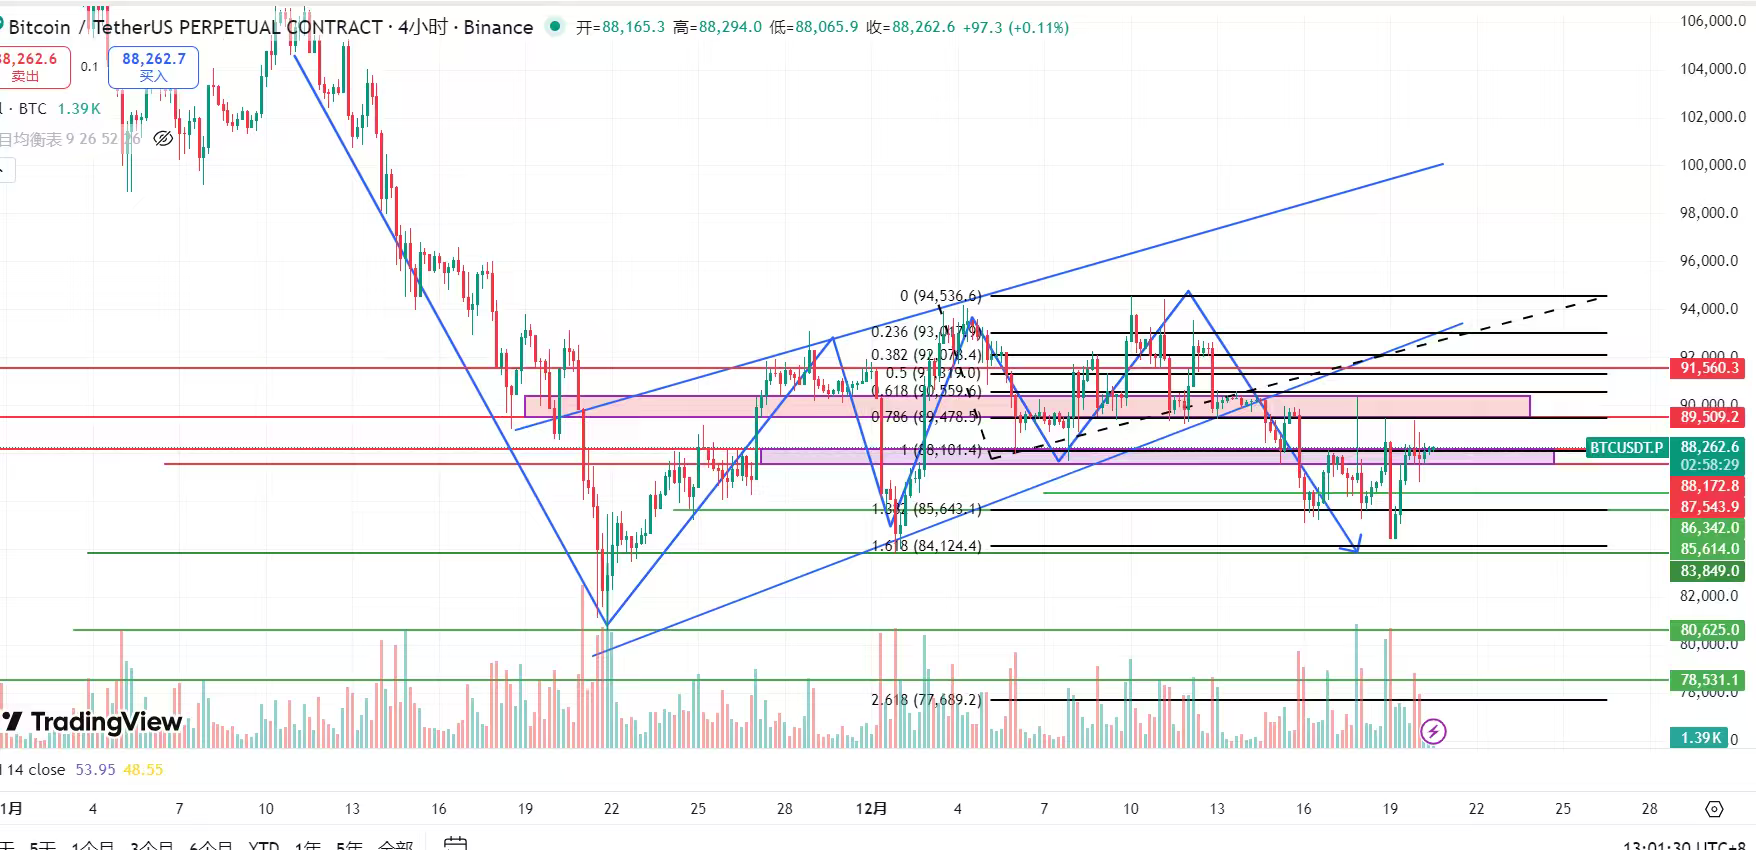
Specific strategy:
Rebound around $89,500 ~ $90,000 ~ $90,600 ~ $91,100 in batches to place short positions, targeting $87,500 ~ $86,000 ~ $85,000 ~ $83,800 to reduce positions by 80% before gambling around $78,500. Defense at $92,400 must be controlled above (a relatively safe stop-loss point; those who can't accept wide stop-loss should reduce positions). Specific stop-loss points should be set based on one's actual position capacity!
Ethereum's price is oscillating in the $2,800 - $3,050 range. Currently, a head and shoulders top has formed in the chart, and the neckline of $3,000 ~ $3,060 has been tested several times and has been pushed down, fully indicating that the head and shoulders top has formed. Theoretically, it should test around $2,630. The current short-term resistances are: suppression around $3,020 at Fibonacci 0.618 level, as well as linear suppression near the daily Ichimoku baseline around $3,060 ~ $3,080. The lower resistances are around $2,915 and $2,840 - $2,790, and the frequently emphasized $2,750. Upon reaching this level, reducing positions by 80% is recommended before gambling around $2,620!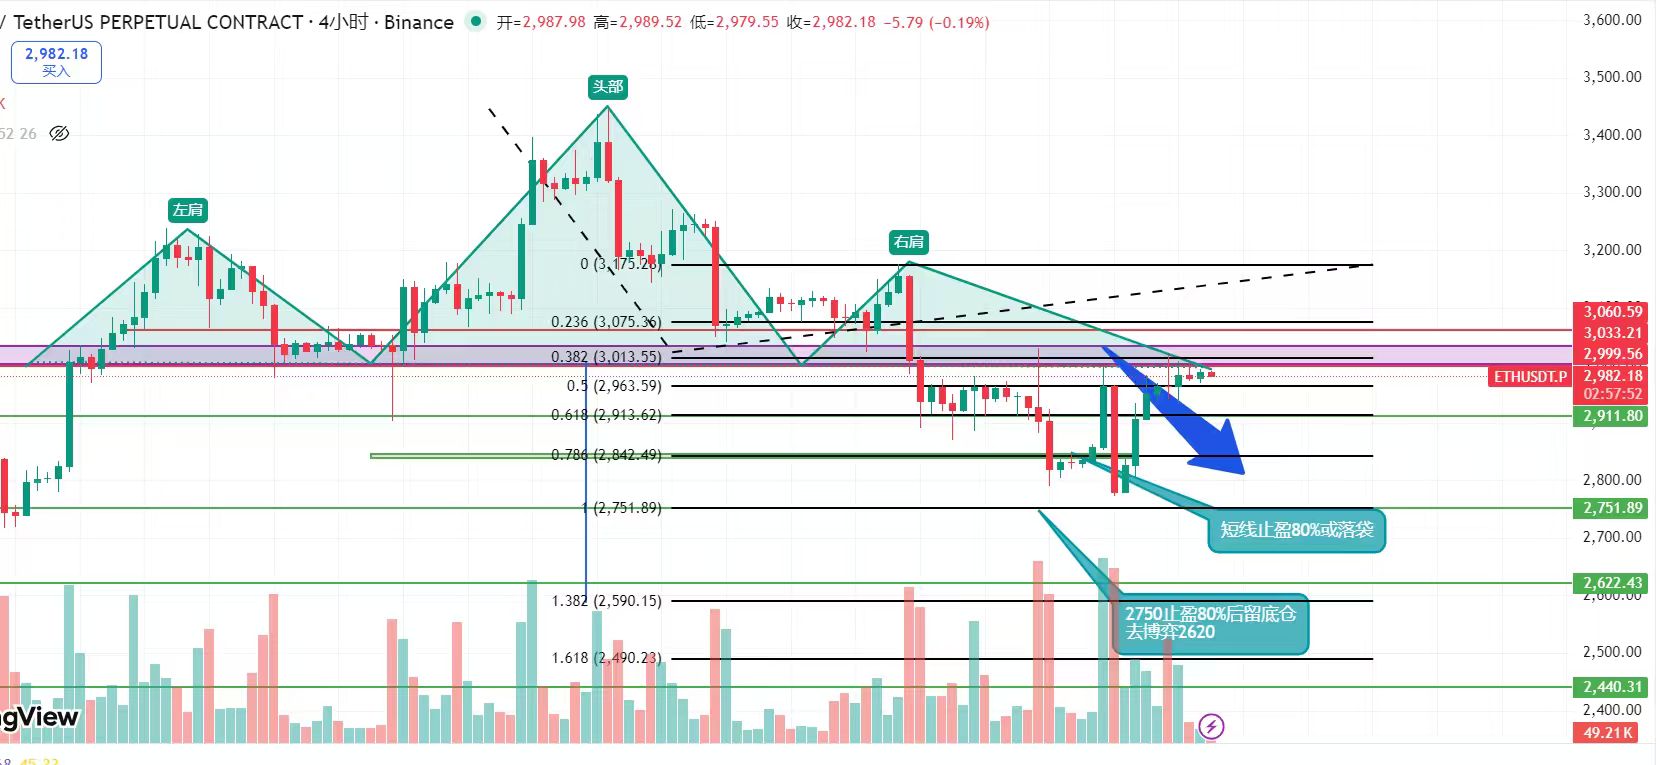
Specific strategy:
Ethereum rebounded around $3,020 ~ $3,060 ~ $3,080 in batches to place short positions, targeting $2,915 ~ $2,850 ~ $2,790 ~ $2,750 to reduce positions by 80%, with remaining positions to gamble around $2,620, and the ultimate target around $2,440, with stop-loss needing to be controlled above $3,160 (those who can't accept wide stop-loss should reduce positions).
No single trade is recommended to exceed 2-3% of total funds. Recent market volatility may be amplified due to low liquidity at year-end and large-scale option expirations, requiring extra attention to position management.
Macroeconomic level: Watch out for the Bank of Japan if it releases stronger tightening signals in the future, which may reignite liquidity concerns. Meanwhile, U.S. inflation data and the Federal Reserve's subsequent statements remain key to shaping long-term liquidity expectations. As well as the "postponement" risk: the key signal in 2026 is that the market's general consensus is this rate hike has been highly anticipated. The real "black swan" risk may not be present now, but lies in the Bank of Japan's policy guidance for 2026. Notably, the Bank of Japan has confirmed it will begin selling its ETF holdings worth about $550 billion starting in January 2026. If this is accompanied by further interest rate hikes in 2026, it could trigger massive unwinding of yen carry trades, leading to sustained selling of global risk assets (including cryptocurrencies).
The market always trades the difference between expectations and reality. Currently, crypto assets are struggling to transform from high-volatility speculative products into macro asset categories with solid fundamentals. This process is bound to be bumpy, but each resilient resistance to bad news adds value to its long-term worth.
Note: All views above are solely conclusions drawn by Jiang Feng from publicly available market data, and there are many uncertainties. Please make rational decisions; profits and losses are to be borne by oneself! The entry and exit points mentioned above have point deviations: BTC: ±100, ETH: ±5 point deviations!
⚠️: Regarding stop-loss: The stop-loss levels mentioned in the article represent a wide range stop-loss, which I believe is a relatively safe position. I recommend everyone to reduce leverage and positions to manage risk!
Friends who need a discount on fees can fill in the invitation code: BTC20242. Fees will be reduced by 20%!
#比特币流动性
Written by: Jiang Feng Capital

