
📍The order book is not an indicator for predicting prices.
It is a liquidity map - showing where the money flow is located.
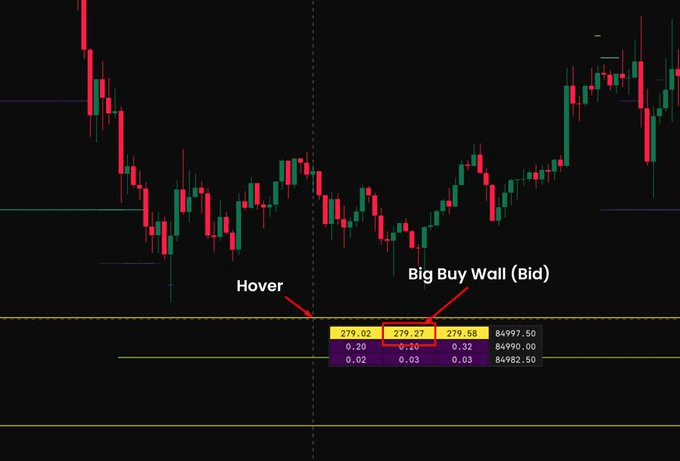
📌 The order book displays:
- Bid: buy orders waiting below the price
- Ask: sell orders waiting above the price
📌 There are two main forces:
- Limit orders: passive, provide liquidity, build a 'wall'
- Market orders: active, consume liquidity, force price movement
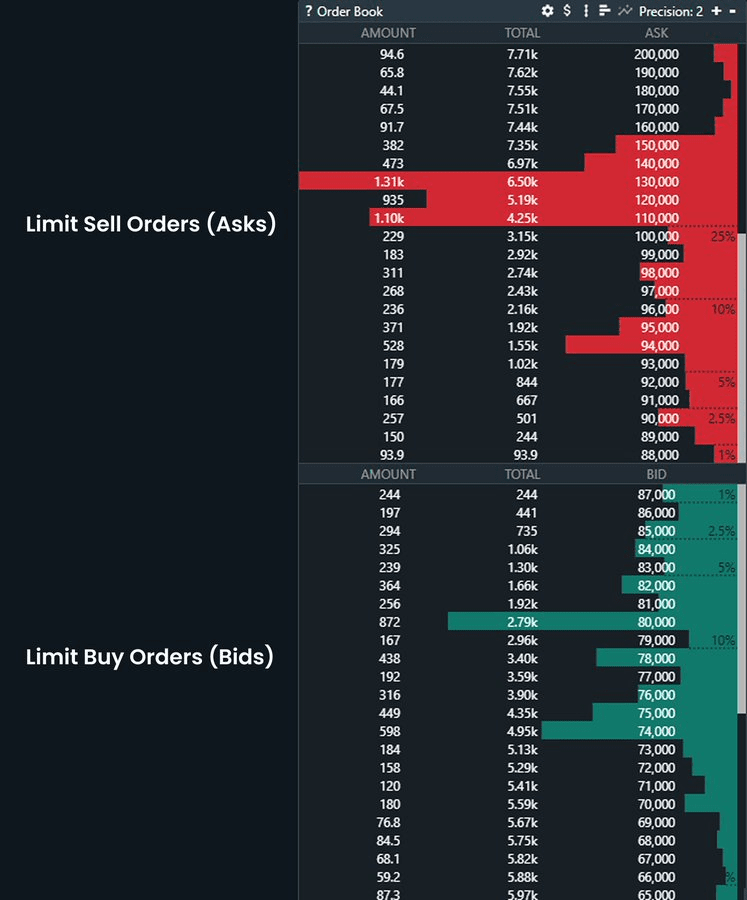
👉 Price only moves when market orders penetrate through the layers of limit orders. The thicker the book, the harder it is for the price to break through that area.
📍Heatmap is a way to view the order book over time
📌 Heatmap draws waiting orders directly on the chart:
- Red: sell wall (sell liquidity)
- Green: buy wall (buy liquidity)
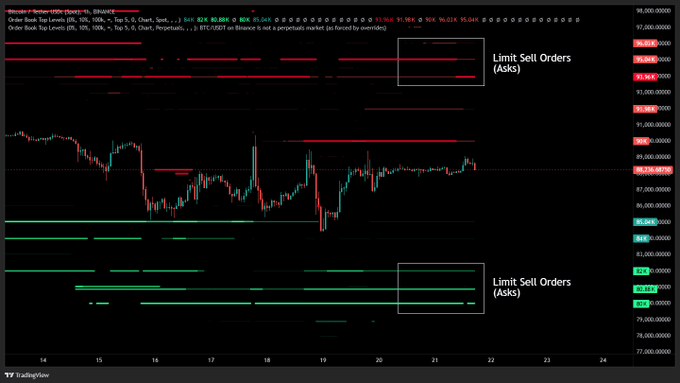
📌 Heatmap indicates:
- Where is the large liquidity located
- How does the price react when approaching those zones
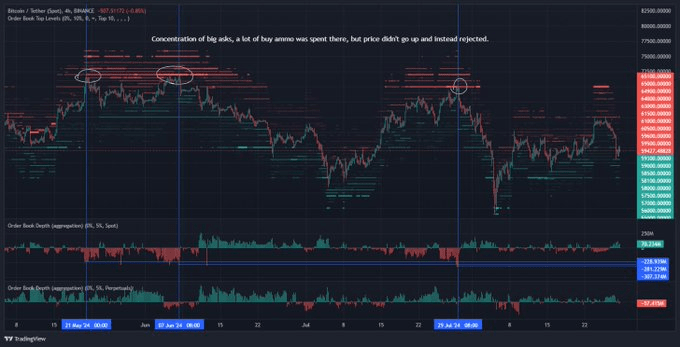
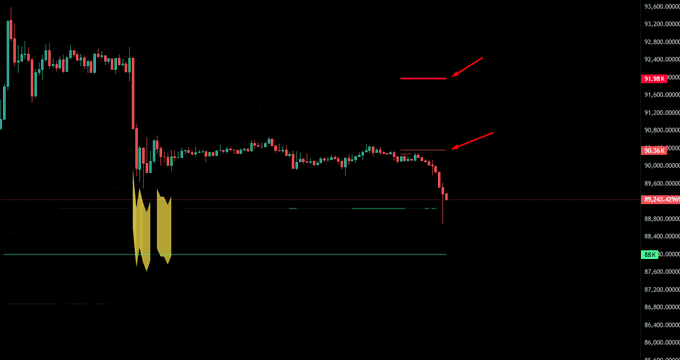
👉 The important thing is not whether there are buy/sell walls, but whether the price can reach the buy/sell wall or retract before reaching it.
📌 If the price continuously tests a bid zone but only wicks and reverses:
🔸 Buying power is absorbing selling power
🔸 Defensive liquidity is very strong
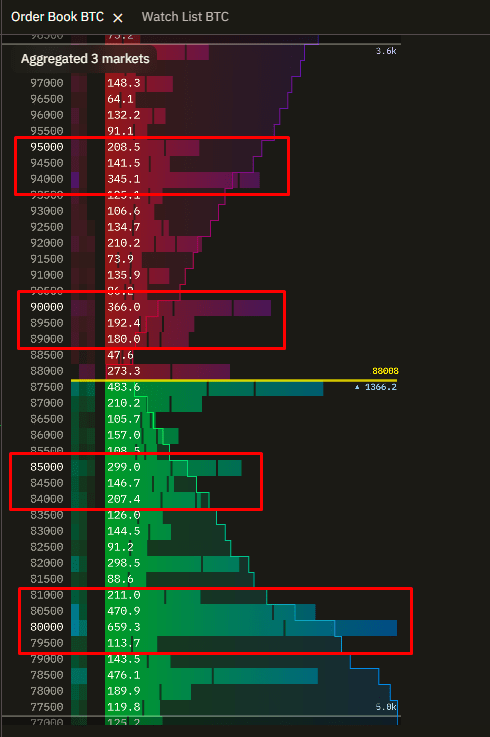
📍Depth = liquidity thickness
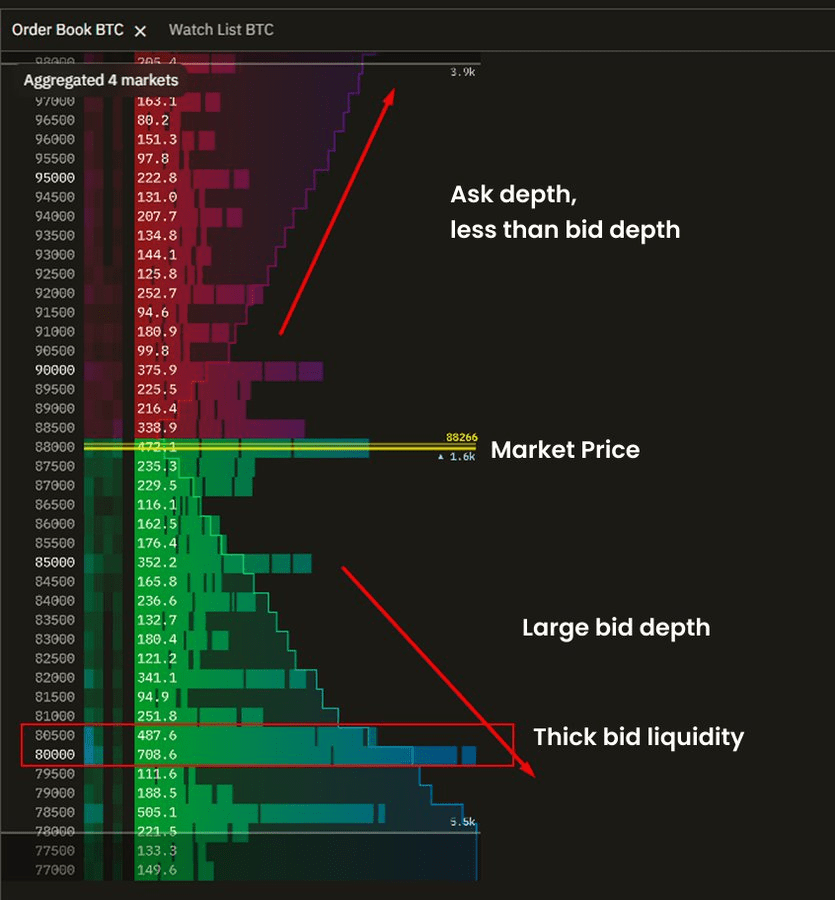
📌 Depth shows:
- Thick book -> many waiting orders -> price is hard to push
- Thin book -> few orders -> price is easy to slide strongly
- “Thick bid” -> a lot of buying power waiting
- “Thin ask” -> little resistance above
👉 This does not guarantee that the price will increase, but it indicates that "falling deeper will take a lot of market force compared to rising".
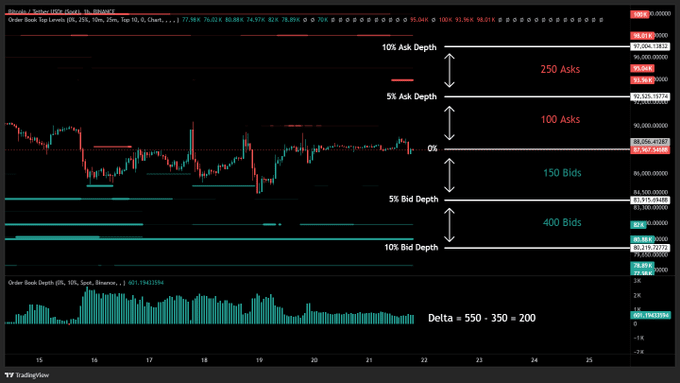
📍What is depth delta?
📌 Depth delta compares total bid and total ask in a % range around the current price.
📌 For example, the 0–10% range:
- Bid: 550
- Ask: 350
- Depth delta = +200
-> This means there is more buying power waiting than selling power
📌 Important note:
🔸 Depth delta is not an entry signal
🔸 It only reflects an imbalance of liquidity
📌 At large depth (10–25%):
🔸 The price can go sideways for a long time
🔸 Liquidity accumulates before the market reacts
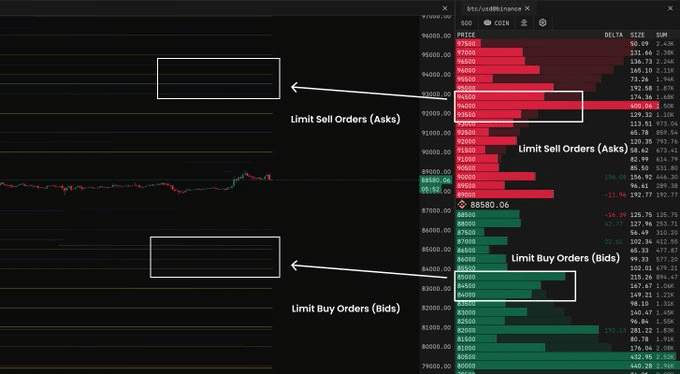
📍Depth overlay = bring liquidity close to the price candle
📌 Overlay displays:
- Green zone: buy liquidity -> potential support
- Red zone: sell liquidity -> potential resistance
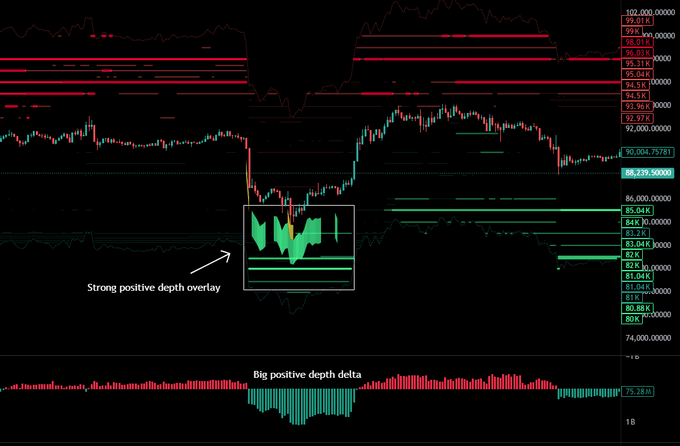
📌 Overlay helps:
🔸 Confirm whether the trend has supportive liquidity
🔸 Early detection of price zones that are likely to be blocked or bounce back
-> Combining overlay + depth delta often provides reversal signals in HTF.
📍To effectively use the order book, it is important to note:
📌 Prioritize spot order book (Binance Spot, Coinbase) -> this is real money
📌 Avoid using perps order book (Lots of spoofing and large orders can appear briefly and then disappear)
📌 Do not read the order book at one point because the duration of liquidity is more important than the size)
📍Conclusion
📌 The order book is not a definitive answer to where the price will go, but simply shows “Where is the liquidity, how thick or thin is it?”
Combining the order book with other data, you will increase your chances of winning in your trades. Step by step, you will accumulate pnl.
