After studying multiple market cycles, one variable continues to dominate Bitcoin’s long-term direction more than any indicator, narrative,$BTC or headline:
Global liquidity.
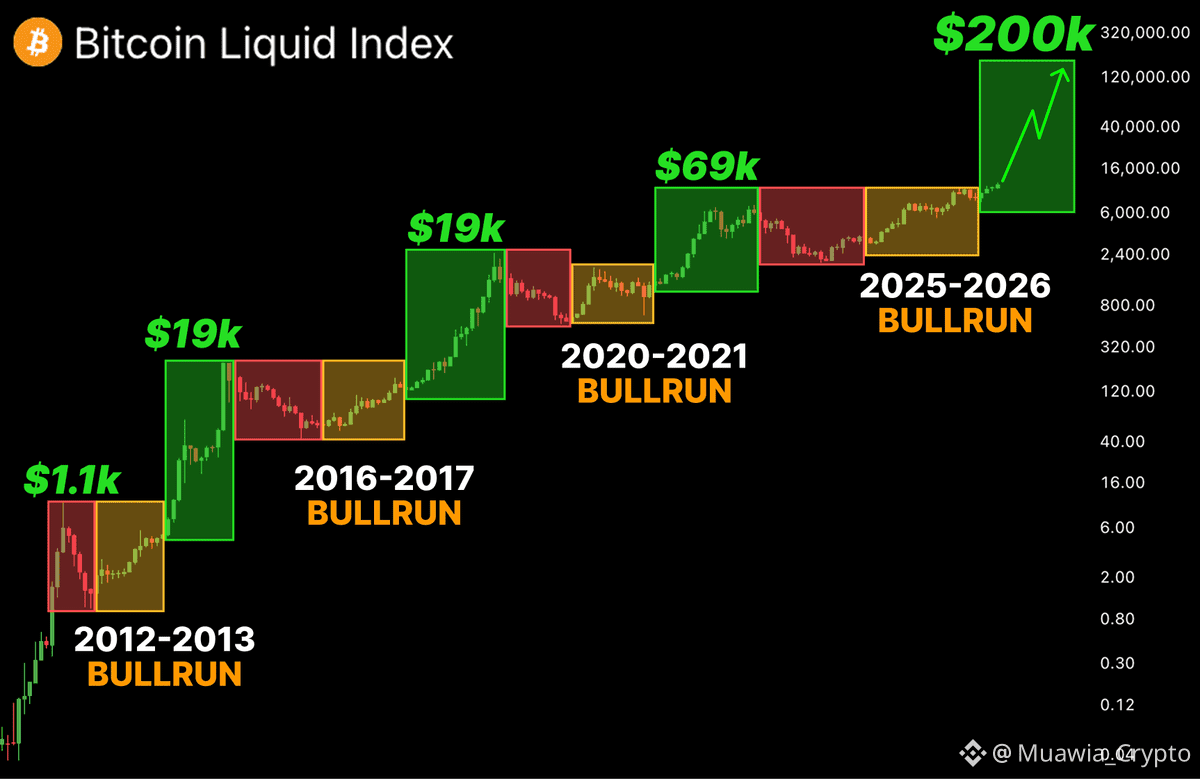
Bitcoin has never moved in isolation. Every major expansion and contraction has aligned with how easy—or how tight—money is across the global financial system.
🔁 THE REPEATING MECHANISM
The pattern is remarkably consistent:
• When liquidity enters the system → price expansion accelerates
• When liquidity is withdrawn → corrections and consolidation follow
This is not coincidence. It is structural.
Bitcoin sits at the far end of the risk curve. It thrives when capital is abundant and struggles when financial conditions tighten.
🧠 WHAT HISTORY SHOWS
By mapping Bitcoin’s price action directly against global monetary regimes, the relationship becomes impossible to ignore:
Quantitative Easing (QE) Phases
• Early QE cycles produced explosive upside
→ +1,600%
→ +960%
QE Wind-Down Periods
• Liquidity slowdown led to sharp, fast corrections
→ −23%
→ −51%
Quantitative Tightening (QT) Phases
• Price became volatile and directionless
→ +49%
→ +20%
→ +25%
Not crashes.
Not euphoric runs.
Transition phases.
⏳ WHERE WE ARE NOW
We are still operating inside a tightening-biased regime. Liquidity remains constrained, and Bitcoin continues to behave exactly as it has in every previous QT environment—choppy, selective, and reactive.
The market is waiting for permission.
🔮 WHAT COMES NEXT
Macro conditions are approaching an inflection point.
If QT concludes and QE re-enters the system in Q1 2026, history suggests a familiar sequence follows:
• Liquidity expands
• Risk appetite returns
• Bitcoin transitions from compression to expansion
Cycles don’t repeat perfectly—but liquidity rhymes every time.
⚠️ FINAL THOUGHT
Price action tells stories.
Liquidity writes the script.
Ignore the noise.
Track the money.
— Professor Mike