📊 Technical Analysis
▪️BTC/USDT Timeframe D1
After approaching the 0.5 fibo zone,#BTCwithdrew to create a pinbar candle, followed by yesterday, July 2, a candle with a small fluctuation range retesting the $62.4xx support zone, showing that selling pressure is not strong. .
As of today, July 3, the Bears increased the pressure by breaking $62.4xx and continuing to drop to the fibo breakdown of 0.236 as well as the trendline extending from June 7.
What needs to be observed here is whether#BTCwill break the Low bottom at $60,000. If it can't hold, you won't see the $65k mark because then the bullish structure has been broken.
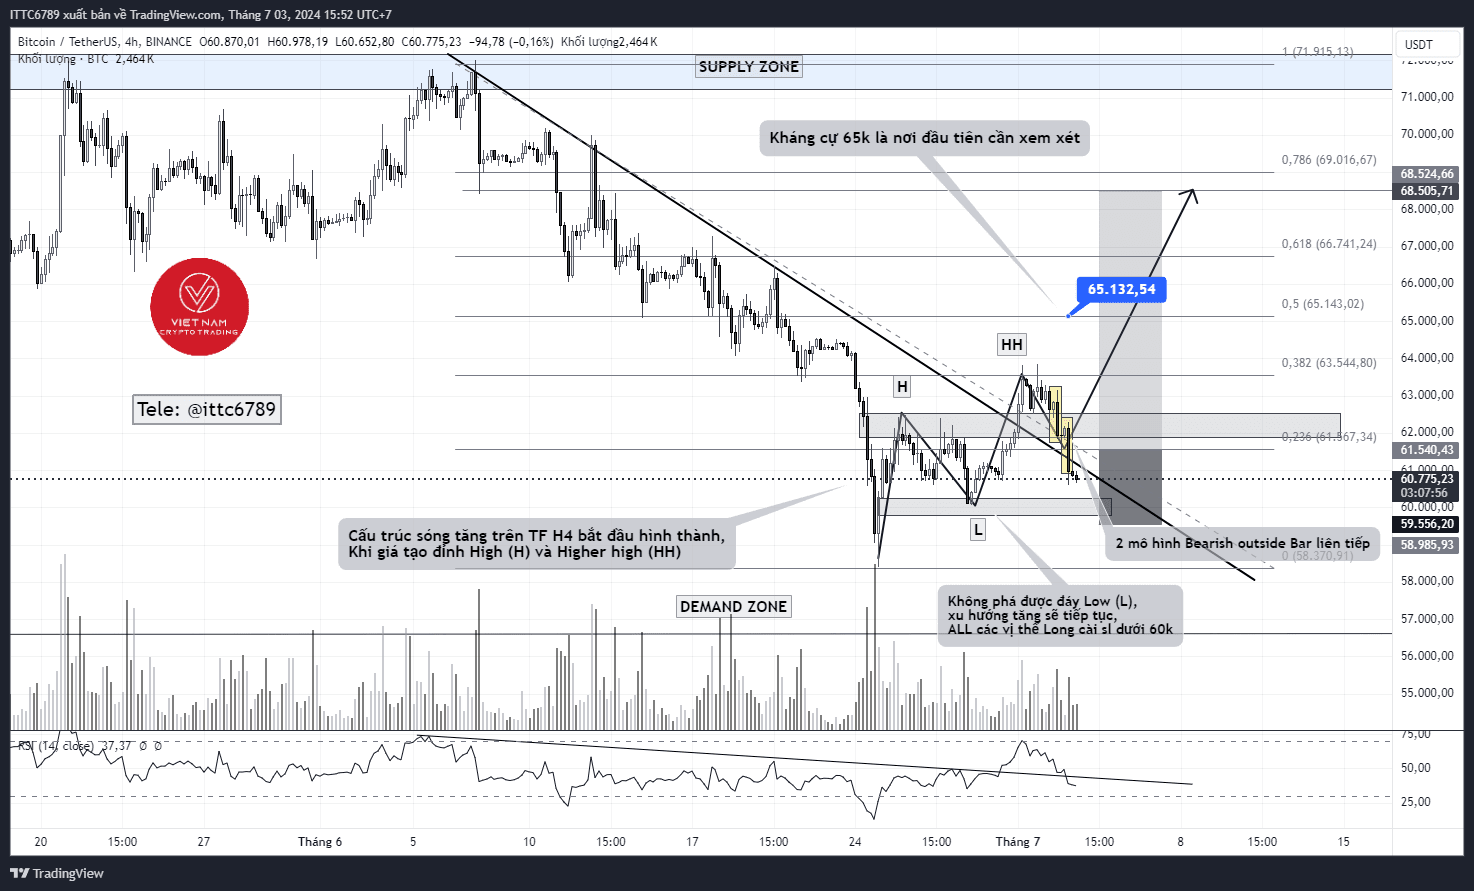
▪️BTC/USDT Timeframe H4
Yesterday's plan was that#BTCwould have a retest and we look for a long point at $61.6xx - $61.9xx. However, the bearish breakout combined with 2 Bearish outside bar models + consecutive weak pullbacks (2 models circled in yellow) caused the price to always fall back to the $60.xxx area.
With the Bears increasing such pressure, the plan for the day leans towards waiting to sell. To confirm that the short-term price uptrend is broken, an H4 candle close below $60,000 is needed.
Now our long order at $61.6xx with sl placed at the bottom of the Low is still running, the plan has been made, let Mr. Market take care of the rest!
▪️Milestones to pay attention to: 58400 - 60000 - 61600 - 62400 - 63800 - 66200 - 68300 - 69000 - 70200 - 72000
* The above is purely personal opinion, not investment advice!
$BTC #Vietnamcryptotrading #ittc6789