BTC market: bearish
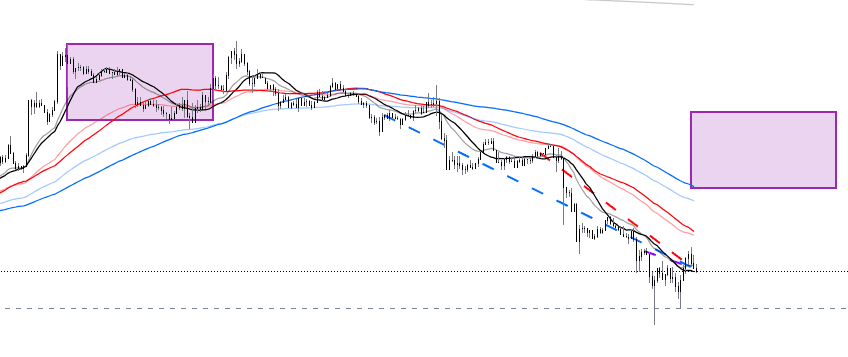
Let’s look at the 15-minute chart first. There is nothing much to say. It is a standard short position arrangement of moving averages.
Looking at the BTC 1-hour chart and the moving average, it is a non-standard or upcoming short arrangement, which means there is room for discussion. The left box represents the range of change of the 60-day moving average discount price. If we move the box to the right, if the current price is greater than the current discount price, then the red 60-day moving average will turn upward and completely destroy this short arrangement. In other words, if the price breaks through the highest price of 62774 in the right box in the next 24 hours, then this short arrangement will not be formed. The price of BTC will stop falling and then fluctuate or rise.
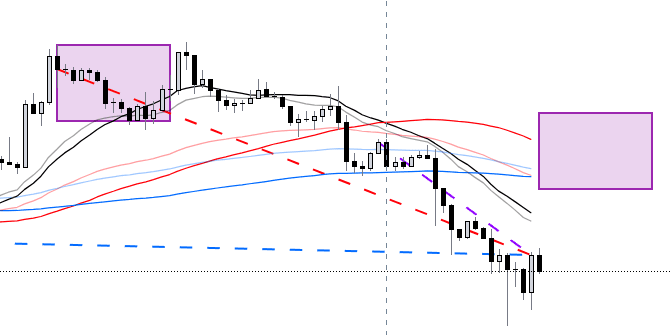
Obviously, the current BTC price is 60389, and it is not easy to reach 62774. In the next 24 hours, if no one pulls up, it will not go up. If it does not go up, it will continue to fall or fluctuate. Don’t go long at this position now, and be cautious about shorting.
There are all possibilities of shocks, sharp rises and sharp falls, but you should not go against the general trend to buy at the bottom
I won't teach you how to open an order, but in this case, only newcomers will think about bottom fishing. Pay attention to me, I will do analysis at the critical moment to avoid a lot of losses for you.
Click the icon below to observe the latest trend and see if the short position arrangement has been broken.
