1. Daily line analysis: Key support tested, can the market stabilize and rebound in the future?
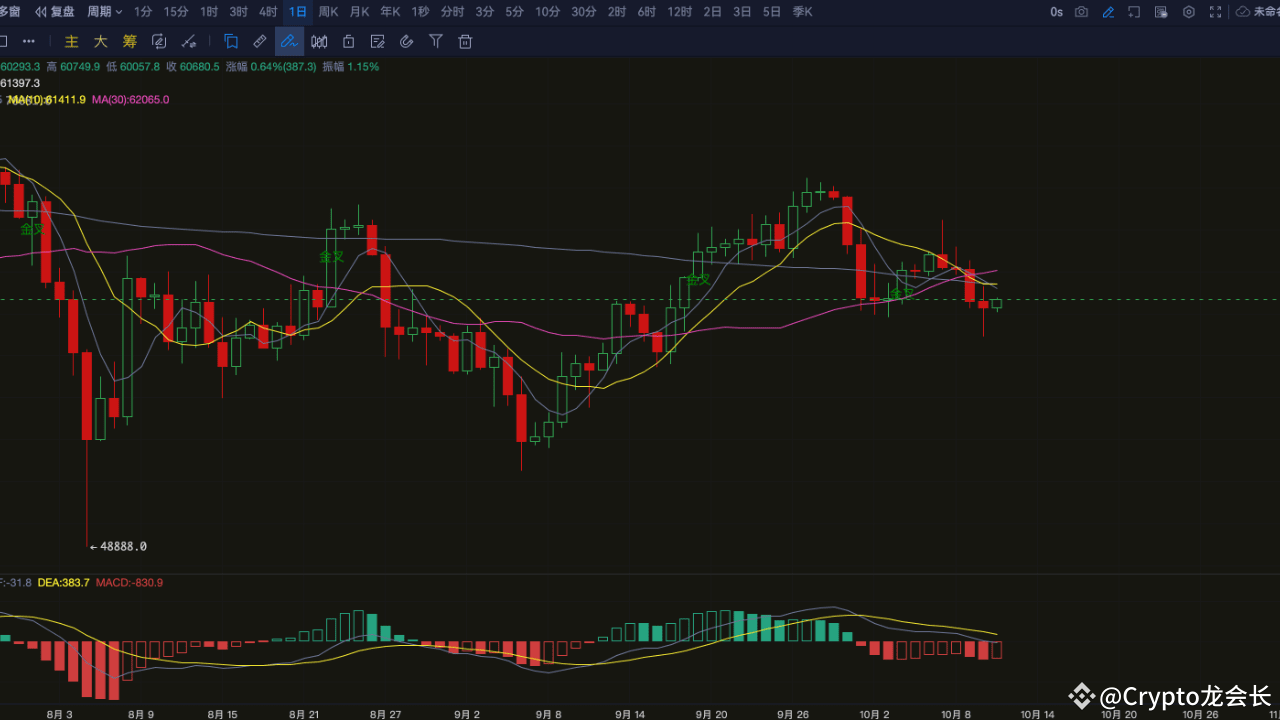
From the daily chart of Bitcoin (BTC), the current price is $60,657, and the overall market is showing a fluctuating trend. Since hitting a low of $48,888 in early August, Bitcoin has gradually rebounded and successfully broke through the strong resistance level of $62,000 in mid-September. However, affected by the short selling pressure from above, the price failed to stand above $62,000 and fell back.
The current price is running below MA30 (US$62,065) and MA120 (US$61,397). The short-term moving average system (MA5, MA10) is in a bearish arrangement, indicating that the short-term market sentiment is cautious. The MACD indicator DIF line (-31.8) and DEA line (383.7) are spreading downward, and the red momentum column continues to shorten, suggesting that the short-selling force is increasing.
The key support level on the daily chart is the round number of $60,000. If this support level is breached, it may trigger a further decline to $58,000 or even $56,000. The short-term pressure level above is the MA30 moving average ($62,065). Once it re-crosses this level, it is expected to open up further rebound space and test $64,000.
Daily operation suggestions:
If the price stabilizes around $60,000, you can consider placing long orders on dips, targeting the $62,000-64,000 range.
If the price falls below $60,000, we need to guard against the risk of accelerated decline. The short order target can be looked at the support level of $58,000 and below, and the stop loss reference is around $61,000.
2. Analysis of the four-hour line: The market is fluctuating and weakening, and there is a choice of direction in the short term
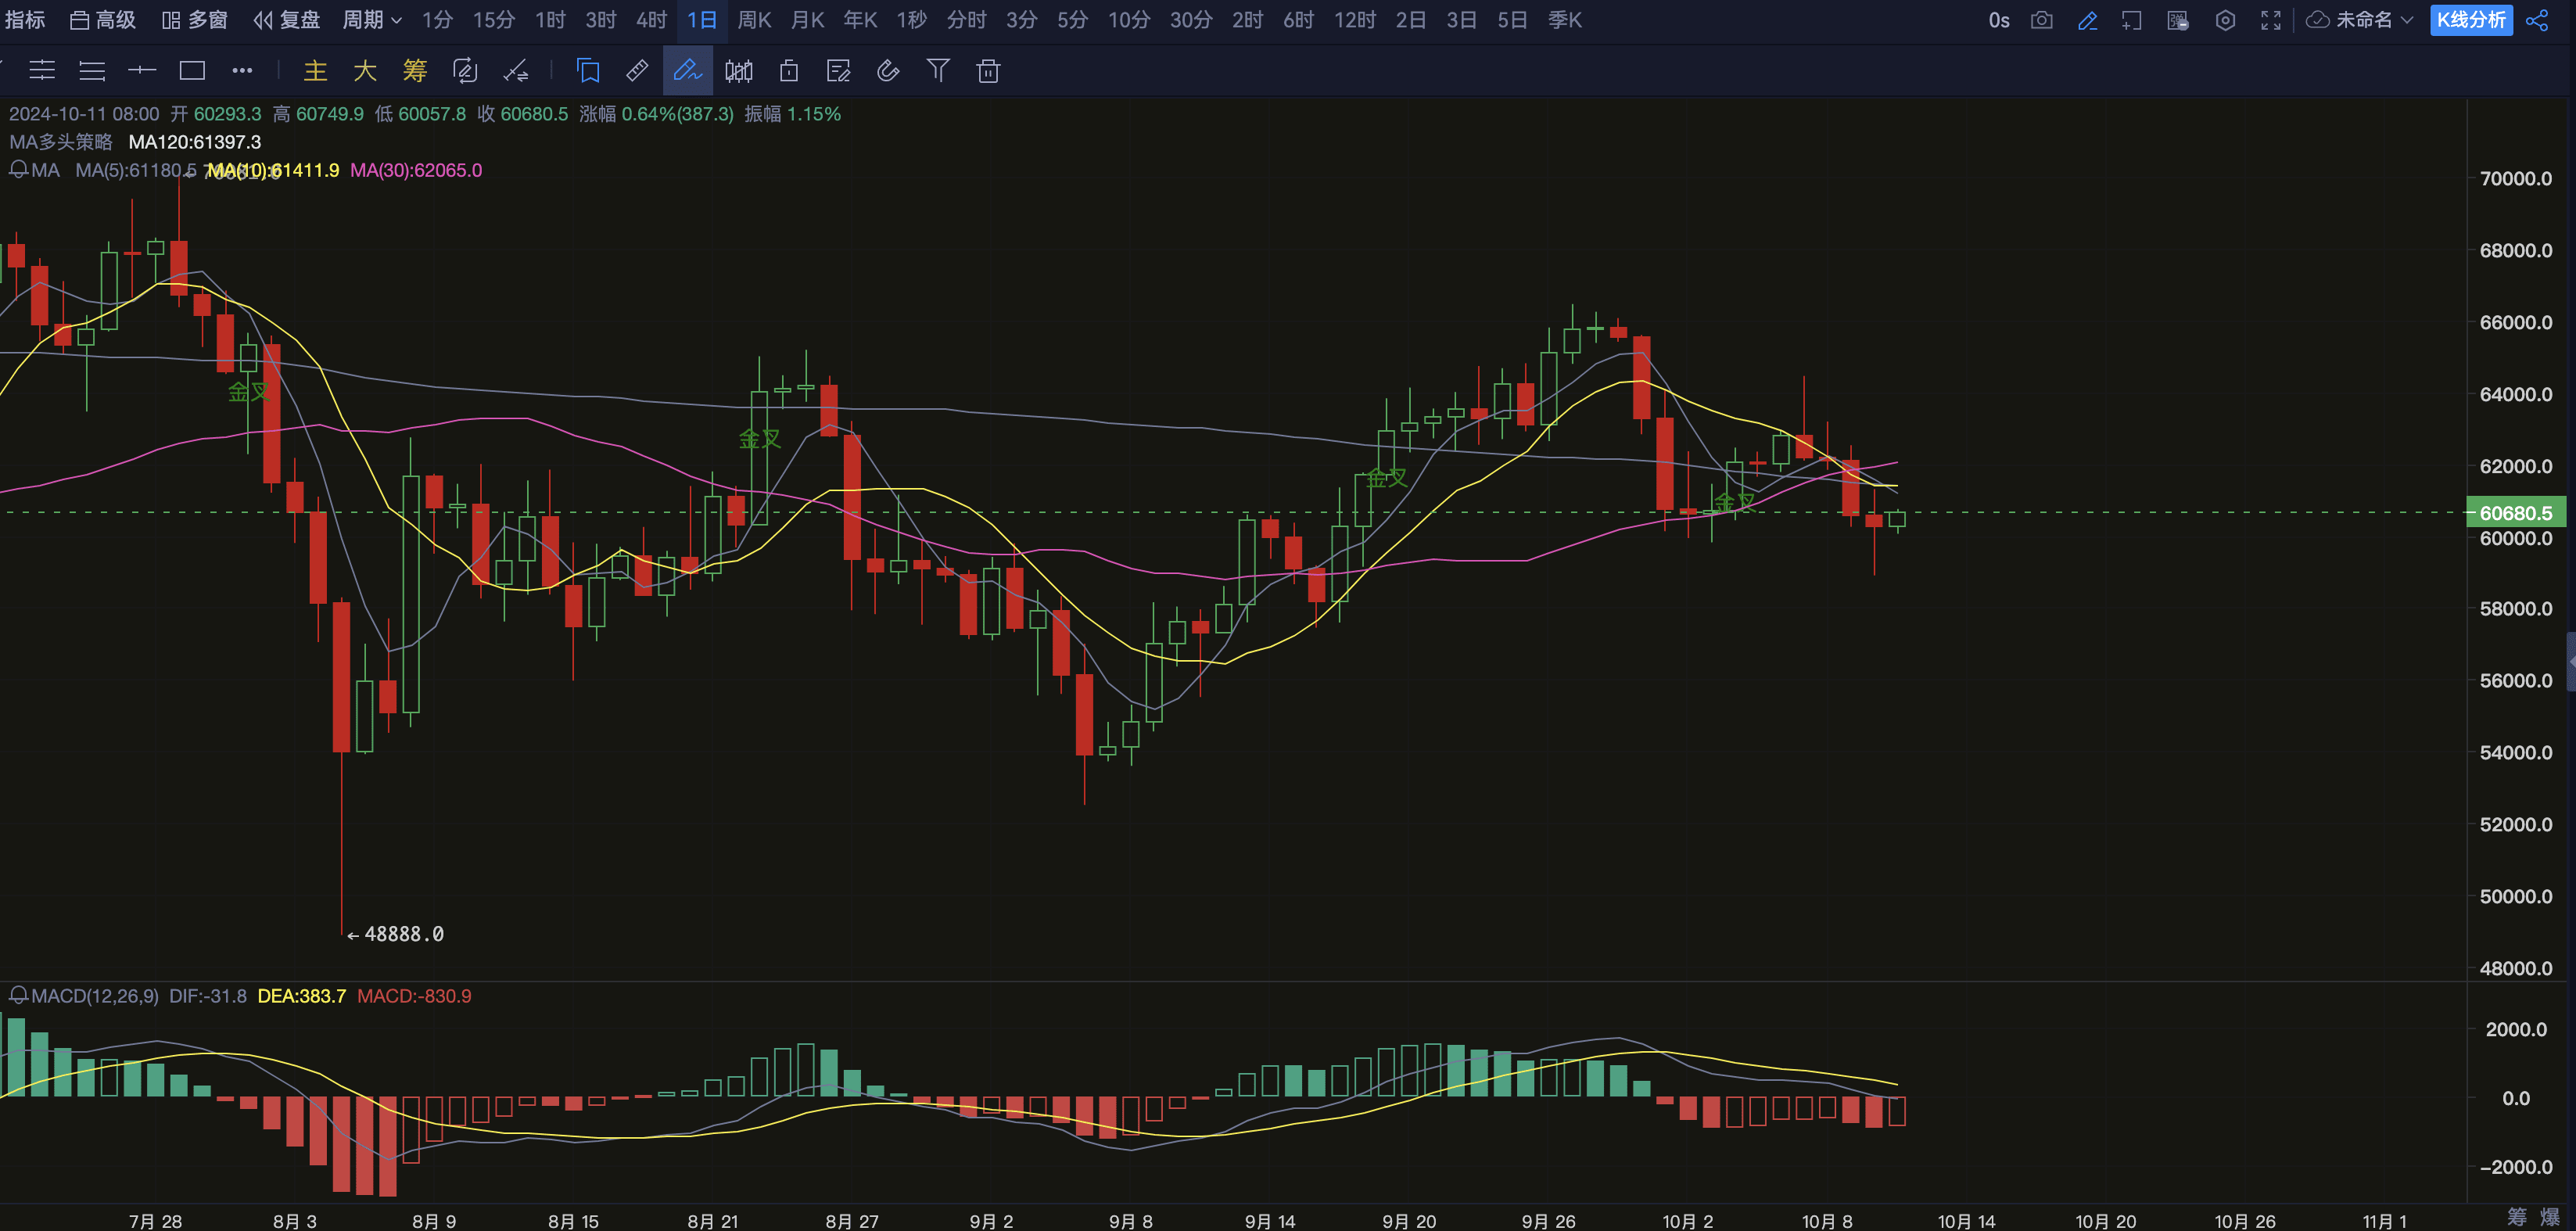
From the four-hour chart, Bitcoin has been fluctuating and weakening since it surged above $62,000 in early October. The current price has fallen below the MA60 moving average ($61,411) and is hovering around $60,600. The short-term market direction is still unclear.
In the moving average system, MA10 (61,411 U.S. dollars) and MA30 (61,200 U.S. dollars) formed a death cross, indicating that the short-selling force has the upper hand, but in the MACD indicator, the DIF line (-31.8) and the DEA line (383.7) formed a bond below the 0 axis, and the red kinetic energy column weakened, suggesting that the short-selling force may have declined.
The key support level is around $60,000. If it can stabilize at this position, it is expected to usher in a short-term rebound. Pay attention to the upper pressure level of $61,000-61,500. If the price falls below $60,000, it may intensify the downward pressure and further test $58,000.
Four-hour operation suggestions:
When it stabilizes above $60,000, you can enter the market with a light long position, with the target at $61,000-61,500. If it breaks through this range, you can continue to increase your long position.
If the price falls below $60,000, you can short sell with the target at $58,000 and the stop loss at $60,500.
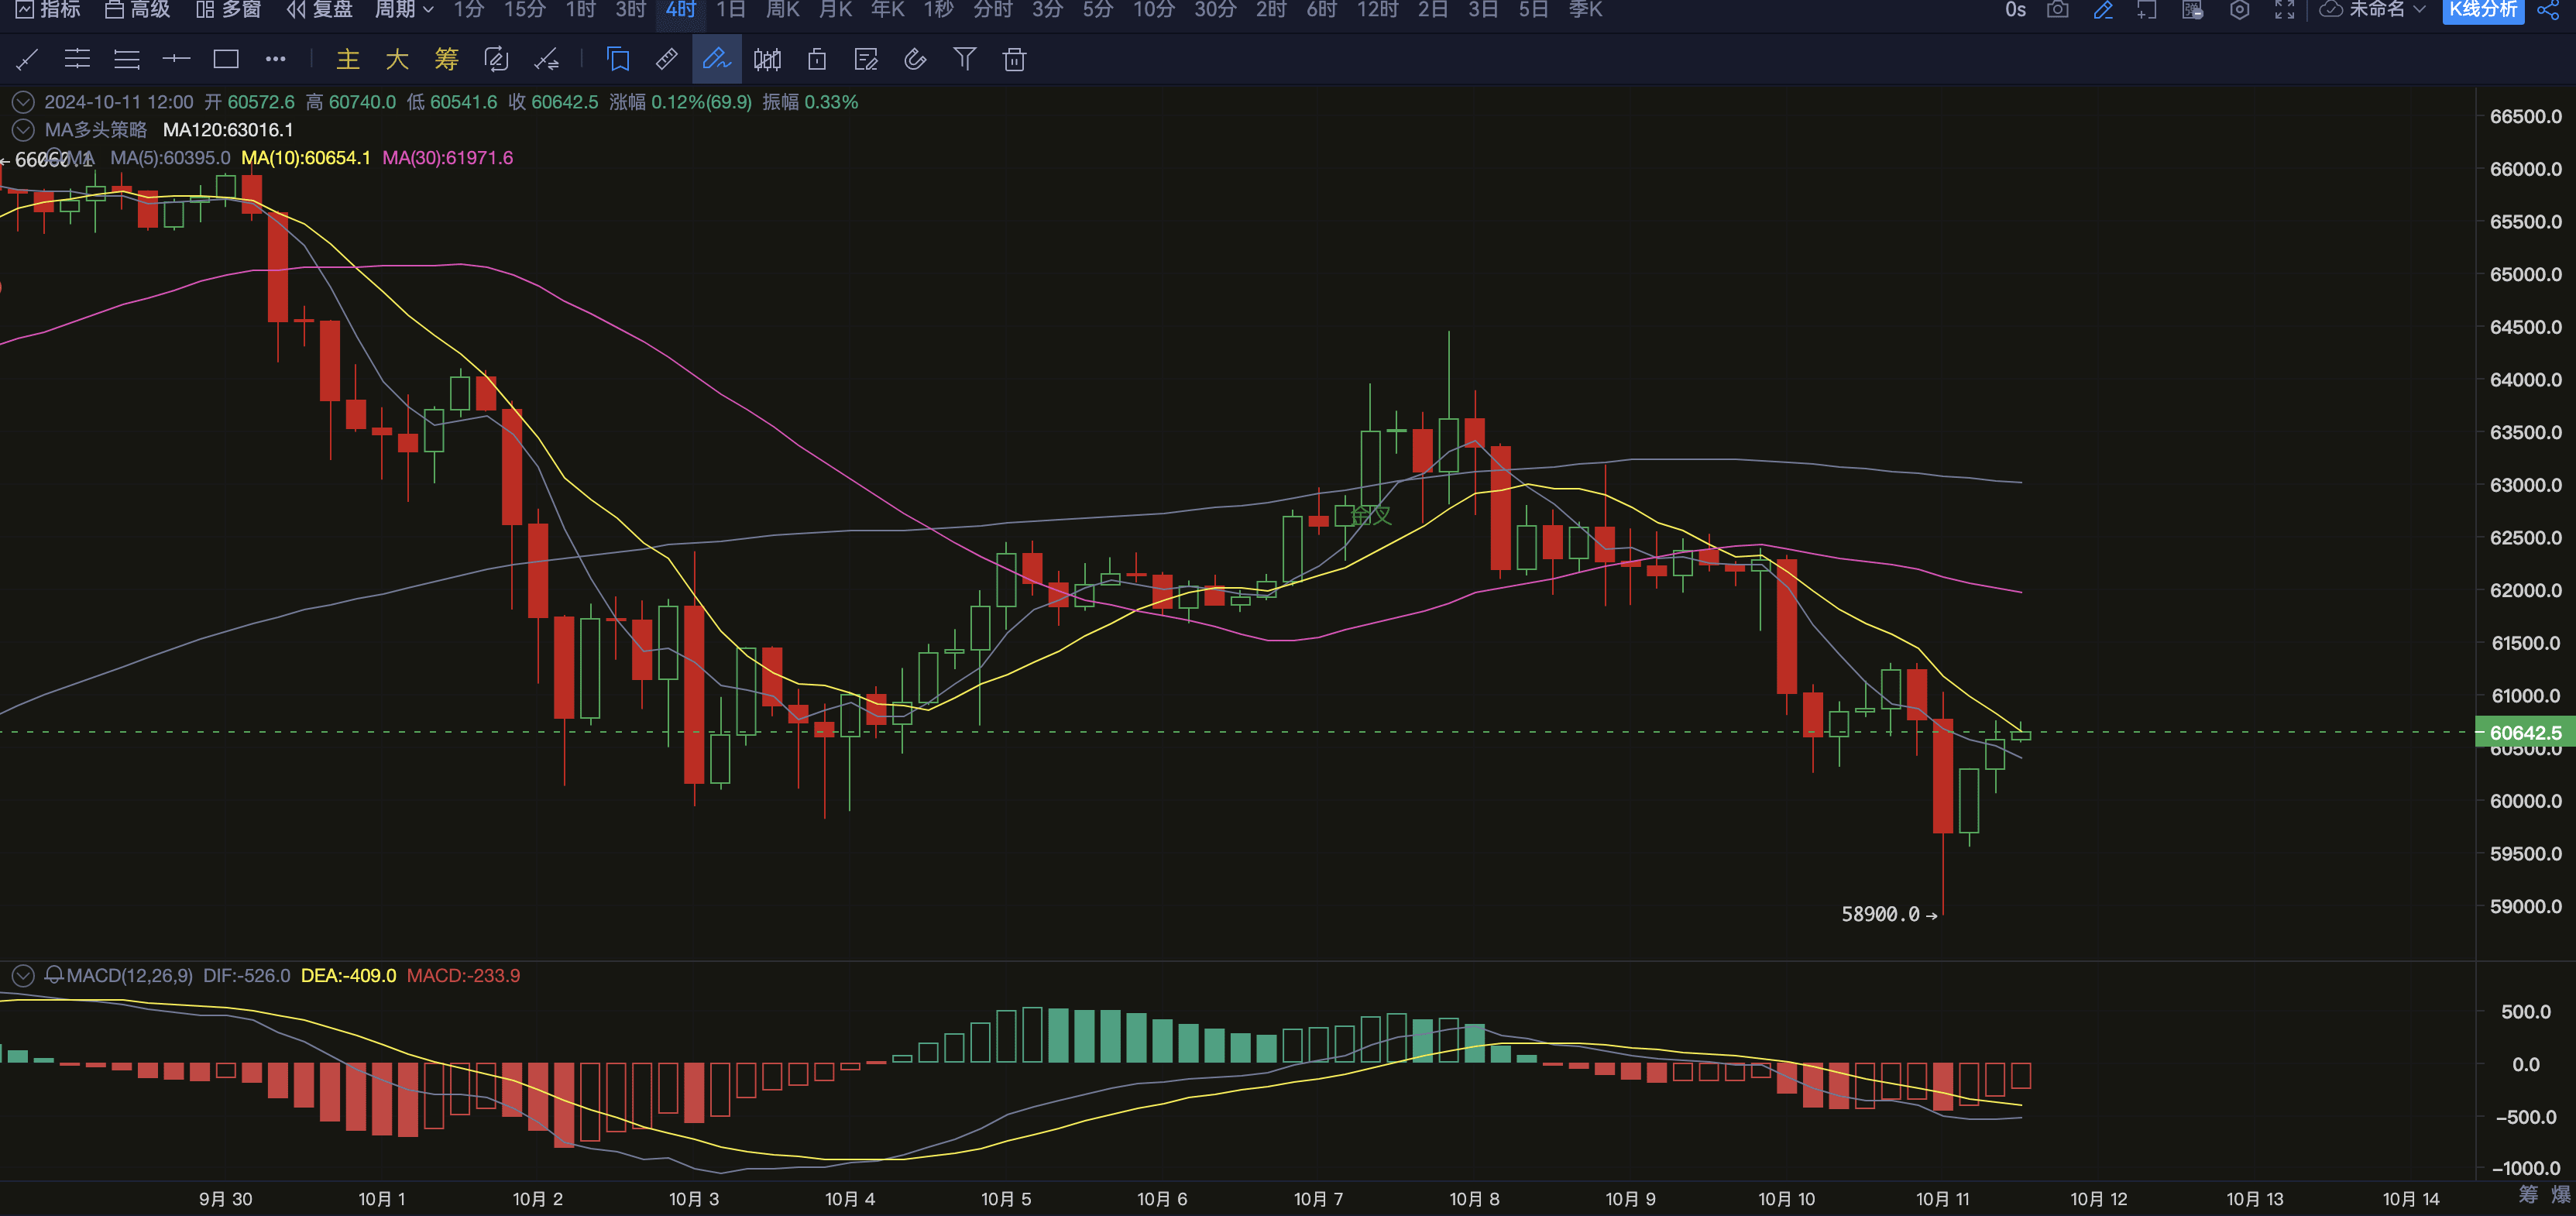
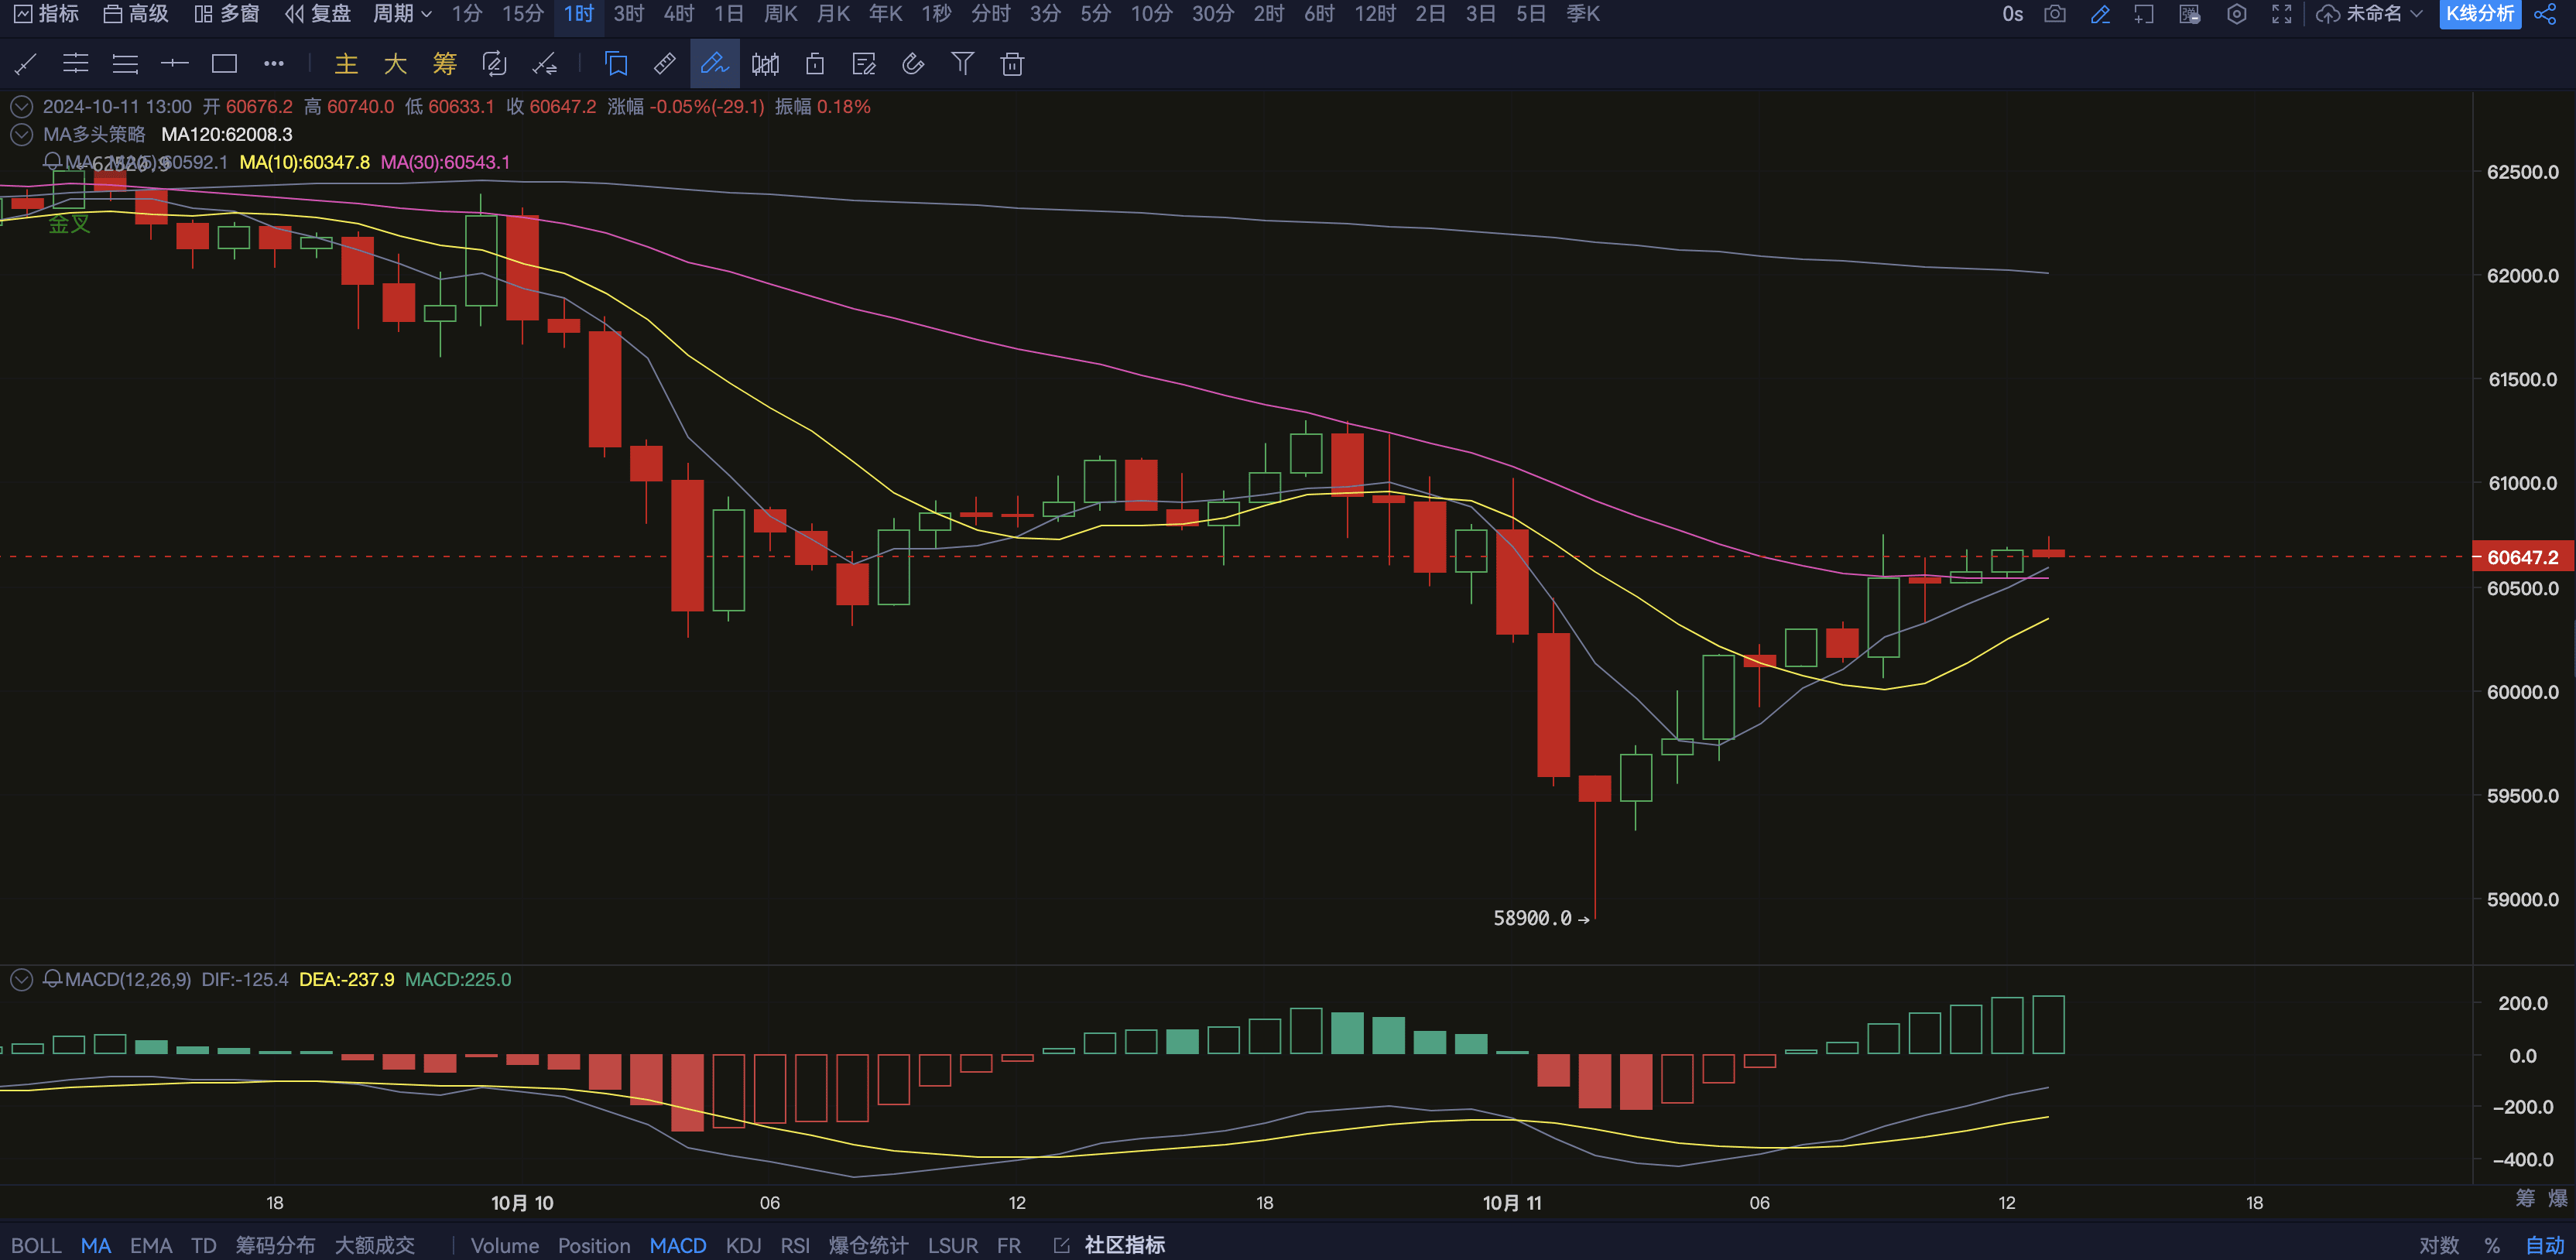
3. One-hour line analysis: Short-term support is beginning to appear, can the bull counterattack continue?
From the one-hour chart, Bitcoin has temporarily stabilized near $60,500 in the short term and rebounded slightly. Currently, the MA5 ($60,700) and MA10 ($60,600) short-term moving averages show signs of stabilization, indicating that bulls are trying to counterattack, but the overall volume is insufficient and the rebound is limited.
The MACD indicator shows that the DIF line (-31.8) and the DEA line (383.7) are sticking together below the 0 axis, and the green momentum column is gradually shrinking, suggesting that the short-selling force has declined, but the short-term market still needs further confirmation of the rebound momentum.
The key short-term support is in the range of US$60,500-60,000. If it can stabilize and rebound with large volume, the target will be the pressure range of US$61,000-61,500. If the price falls below US$60,500, the short-term downside risk will increase, and the target will be the support of US$60,000 and below.
One-hour operation suggestions:
In the short term, you can consider going long with a light position around $60,500, targeting the $61,000-61,500 range, and setting a stop loss below $60,000.
If the price falls below $60,500, short orders can be entered, targeting the $60,000 or even $58,000 support levels.
4. Strategy summary: $60,000 support becomes the key, and the long-short game intensifies
Overall, Bitcoin fluctuates above $60,000 in the short term, with long and short forces intertwined in the market, and the short-term trend tends to be cautious. The daily, four-hour and one-hour lines all show short-term pressure, but there is certain support near $60,000. The market will pay attention to the stabilization of this support level. If it can successfully stabilize and rebound in large volume, it is expected to start a new round of rebound.