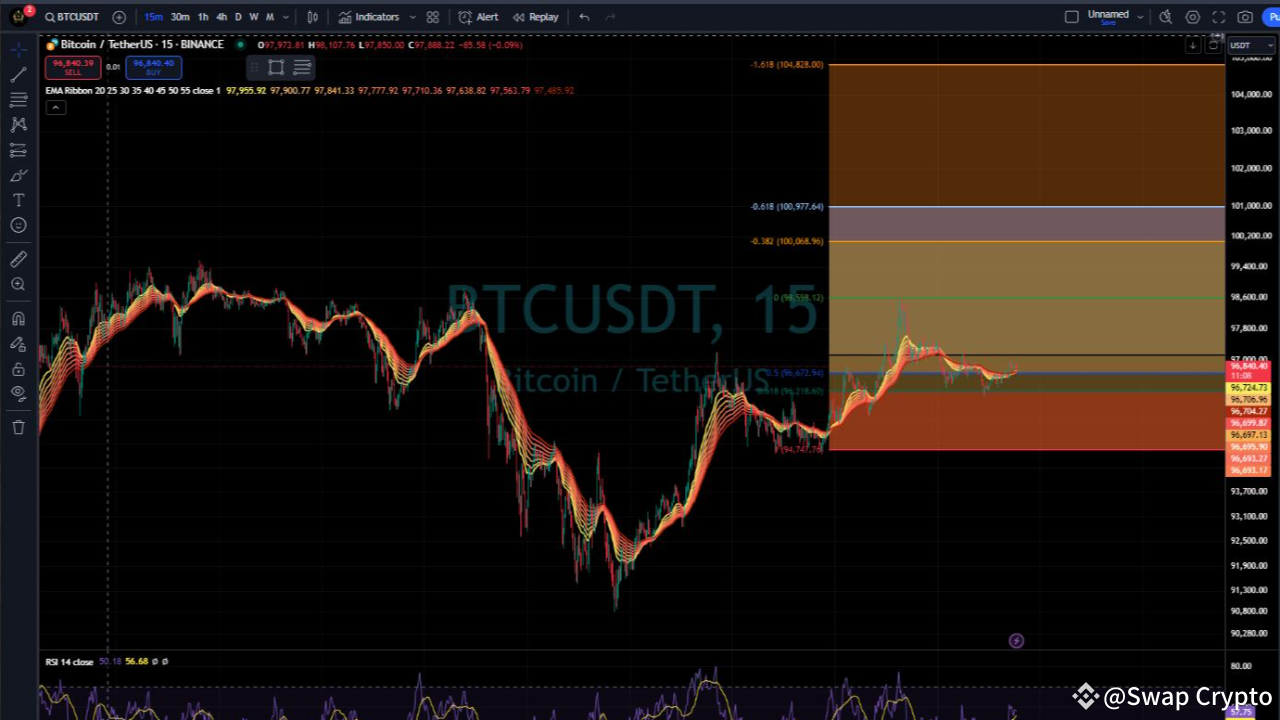
This Bitcoin (BTC) chart is a visual rollercoaster 🎢, but the signs are optimistic! 🌟 We can see a steady climb with the Fibonacci retracement levels playing the guiding lights 🚦. BTC is currently holding strong around the $97,000 zone 💪, consolidating after recent volatility. The EMA ribbons are supporting like true friends 📈, suggesting a potential breakout to the upside. RSI shows a gentle recovery, teasing bullish vibes 👀✨. The next Fibonacci targets of $100K+ are gleaming like treasures at the end of the rainbow 🌈🏴☠️. If BTC keeps its momentum, it might just skyrocket 🚀 past these levels. HODL tight; the king of crypto might be flexing its muscles soon! 💥👑 #BitcoinForever

This USDT Dominance (USDT.D) chart is signaling potential weakness in stablecoin dominance 📉. A classic Head and Shoulders pattern has formed, which often indicates a bearish reversal 🤔. The neckline has already been breached, suggesting that capital might be flowing out of USDT and into other crypto assets 🚀—hello, BTC bulls! The RSI is hovering near neutral, showing room for further downward momentum 📊. This is exciting news for risk-on assets, as a decline in USDT dominance typically accompanies bullish momentum in the broader crypto market 🌟. Keep your eyes peeled for confirmation, but it looks like Bitcoin could flex its king status soon 👑. It's time for the market to shine while USDT takes the backseat! ✨ #CryptoMomentum

This BTC liquidation heatmap reveals a stable consolidation phase 💹, with leverage levels clustering tightly at $96K. Liquidation activity hints at suppressed volatility 🤔, but it’s brewing momentum—ready to pop! 🚀 #BtcToMoon 🌕

Entry: 96759.80 or Market Price
1st Tp: 97808.58
2nd Tp: 98310.28
3rd Tp : 98814.55
This signal is only for spot if you want future signals join my binance live.
Just click on my profile to join my live.
