
Price $XRP has recently reacted to key support zones, bouncing off key levels several times. If the correction low holds, price could move higher, which could eventually lead to another correction phase before moving further.
This analysis will cover the current uptrend and the ongoing pattern that could shape XRP's near-future price movement.
Triangle pattern in correction phase
The current price structure shows an ongoing triangle pattern within the context of a corrective phase that began around December 3 of last year. While triangle patterns are not always the most common corrective structure, they do appear from time to time, especially during wave four corrections.
XRP has shown a tendency to form a triangle pattern in its price action. There have been several bullish breakouts after forming the triangle pattern throughout November and early December. This pattern suggests that XRP may be in the midst of another triangle pattern.
Analyze current consolidation and disruption
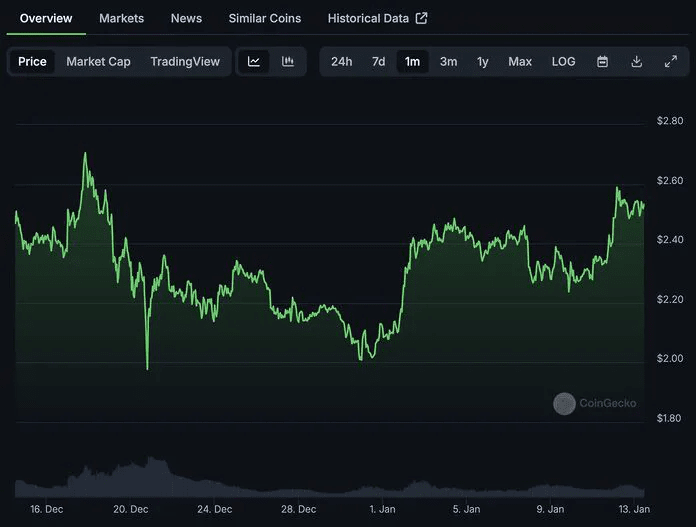
XRP is currently consolidating above the breakout point from December 1, indicating continued market strength. Ideally, holding above this level would indicate that the uptrend is intact. The price has formed a series of lower highs and higher lows, which fits the structure of a triangle pattern. Each part of this pattern is corrective, indicating a series of three-wave movements.
Important levels to watch
If the price drops below $2.41, it could signal a possible reversal and top formation. This level represents a 50% retracement of the recent rally, so it is an important point to watch.
On the upside, the next resistance level is $2.72, the high of wave B. A breakout above this level could lead to a retest of the December high around $2.90, with the all-time high of $3.40 potentially on the cards if the new bullish momentum is triggered.
