🔍 Levels — what are they?
Let's go 👇
Levels are key horizontal zones on the chart where the price often stops, reverses, or 'pauses'.
In simple terms — these are places where in the past there was a battle between buyers and sellers, and the market 'remembered' these values.
Such behavior is related to:
Accumulation of large orders;
Psychological perception by traders;
Balance of supply and demand.
💡 These zones are like the market's memory map. Where there was a reaction before, it is highly likely to repeat.
💡 Main types of levels:
🔹 Support
A level below which the price does not want to fall.
From here, a bounce upwards often begins.
🔹 Resistance
A level above which the price cannot pass.
Often becomes a turning point downwards.
📊 What other levels are there?
Accumulation/distribution — sideways movements, where the price stays in a narrow range for a long time → then breaks out with momentum.
Local extremes (High/Low) — important on smaller time frames.
Psychological levels — round values: $1, $10, $100, $1000.
Zones, not lines — as in imbalance, a level is more often an area than a precise price (e.g., $0.98–1.02).
🔧 How to draw levels?
Look for places where the price touched and reversed 2+ times.
Draw a rectangular area (this is more often an area than a line).
Look at volumes — if there were spikes in volume at the level, it is important.
Consider the timeframe:
On 1W/1D — key levels.
On 4H/1H/15m — local and intraday.
✅ How to use levels in trading?
The price has reached resistance → you can wait for a pullback or breakout.
The price is at support → looking for confirmation to enter a long position.
A breakout of a level often gives momentum — especially if the level 'held' for a long time.
⚠️ Important: a level is not a point, not a line, but an area ($0.00190–0.00200.)
📌 Example: Notcoin (NOT/USDT) — key levels
On the daily chart, NOT highlights 3 main zones and one local level:
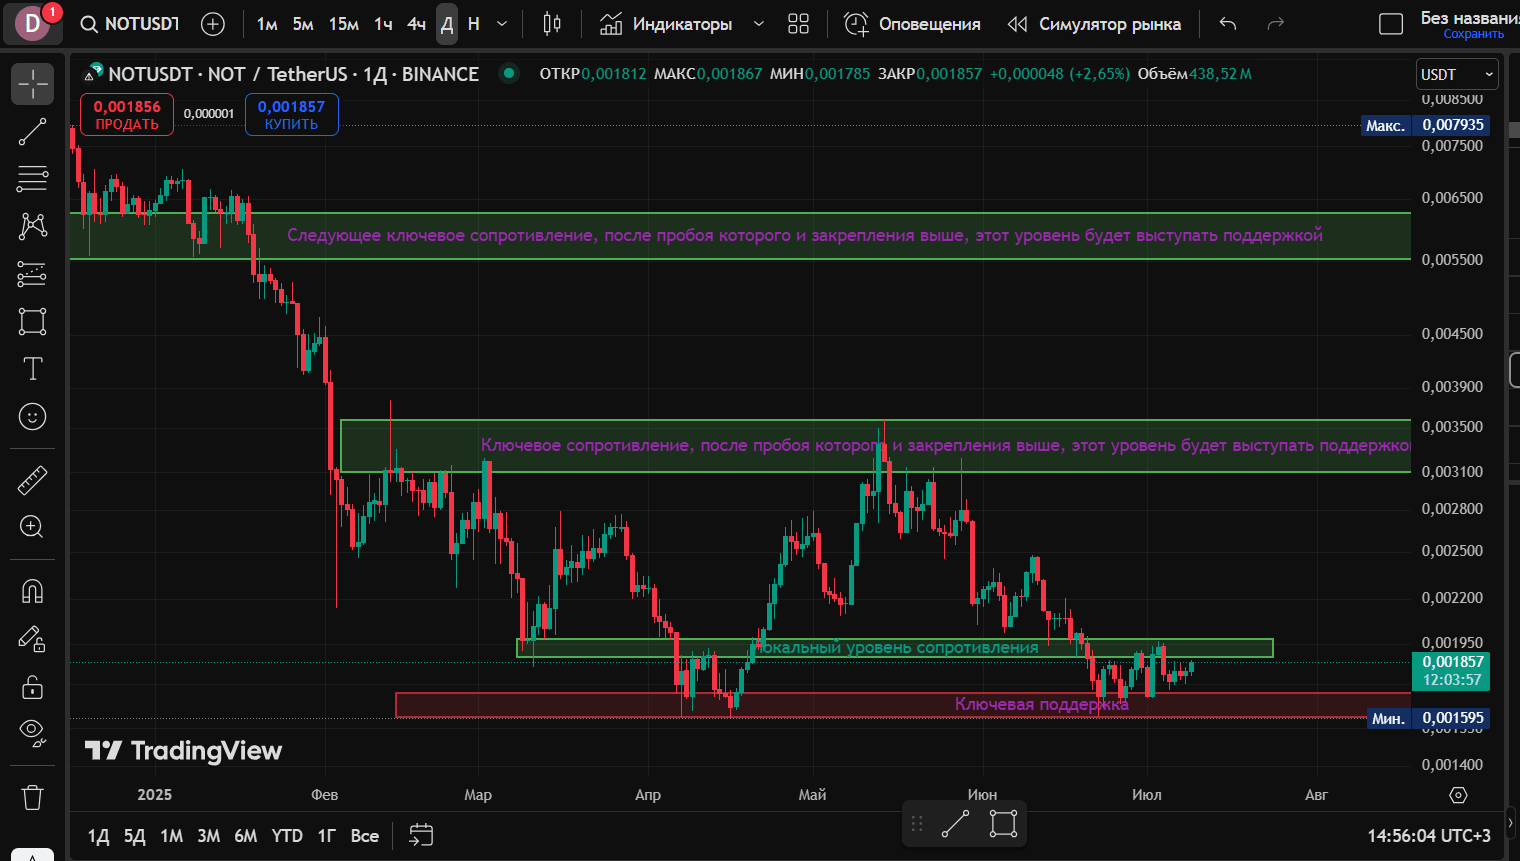
🟥 Zone 1 — Support ~$0.00160–0.00175
This is the current 'floor' for the price.
Several touches: end of April, May, July — and each time a bounce.
Buyers are actively positioned here. As long as the price is above this zone — the growth scenario is prioritized.
Breakout — a signal of weakness and a chance for a decline below.
🟩 Zone 2 — Resistance ~$0.00300–0.00340
The price tested the level twice: in February and May, but could not break through.
A strong zone of sales and fixation.
A breakout with consolidation above → opens the way to the next level.
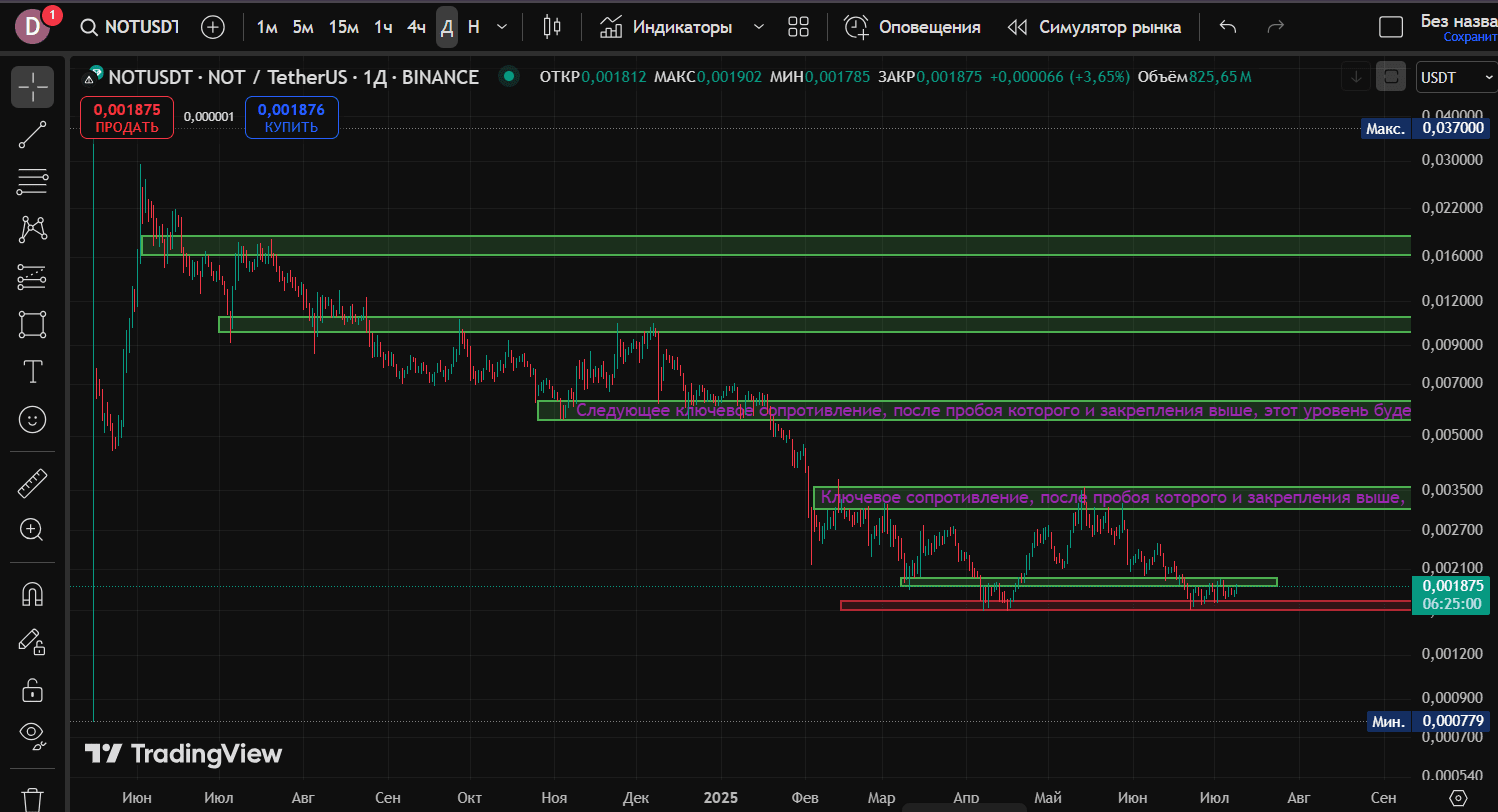
🟩 Zone 3 — Mirror resistance ~$0.00550–0.00620
Previously in February — strong support, but after a breakout down — became resistance.
A classic example of a mirror level.
If the market returns there — it might be the final target of medium-term growth.
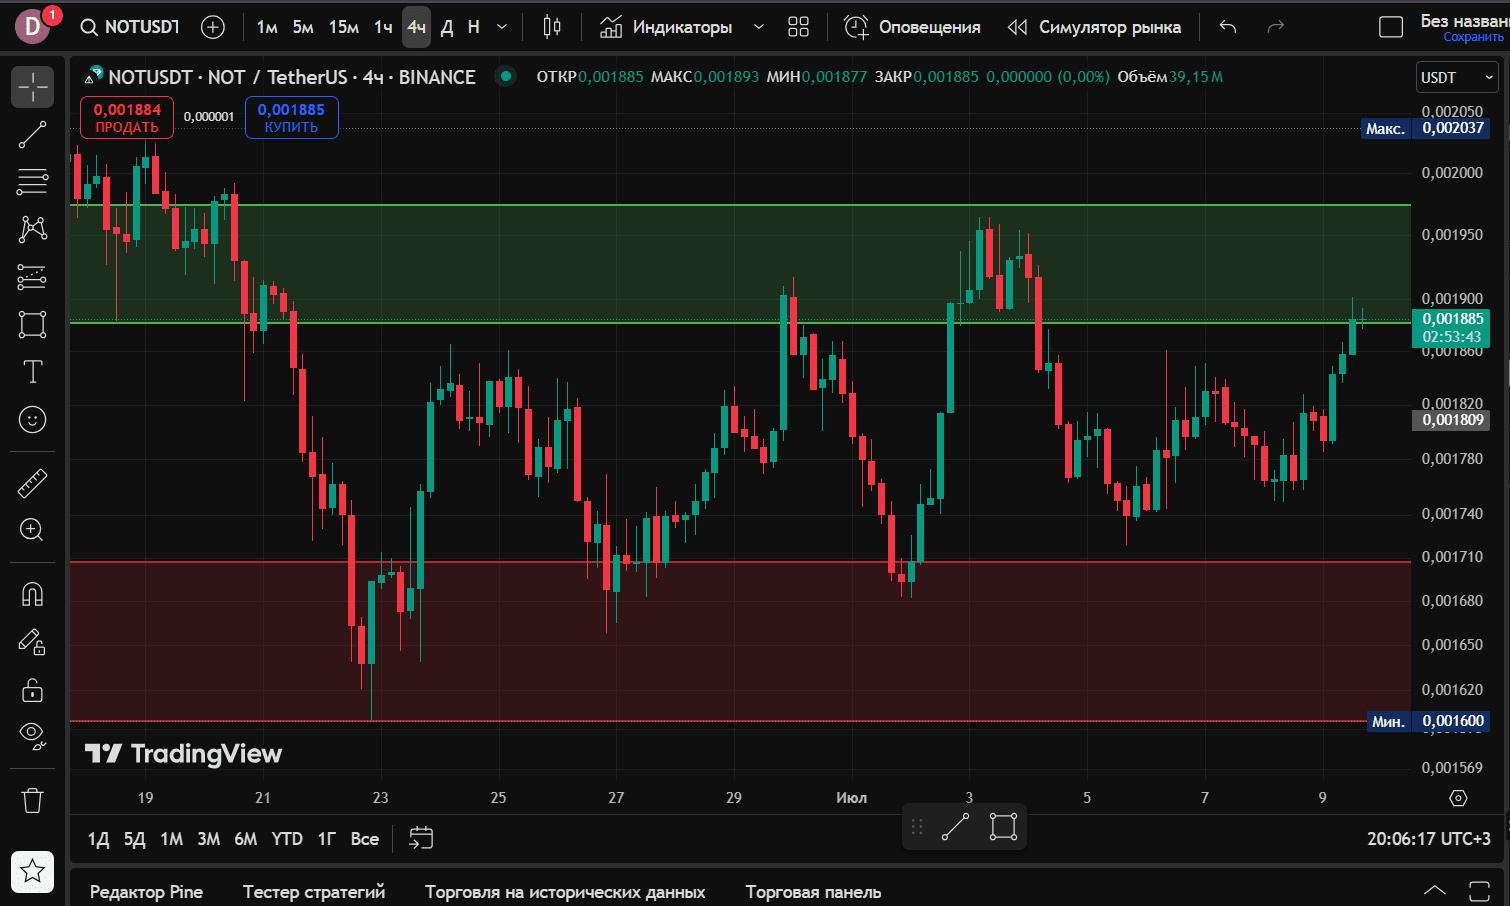
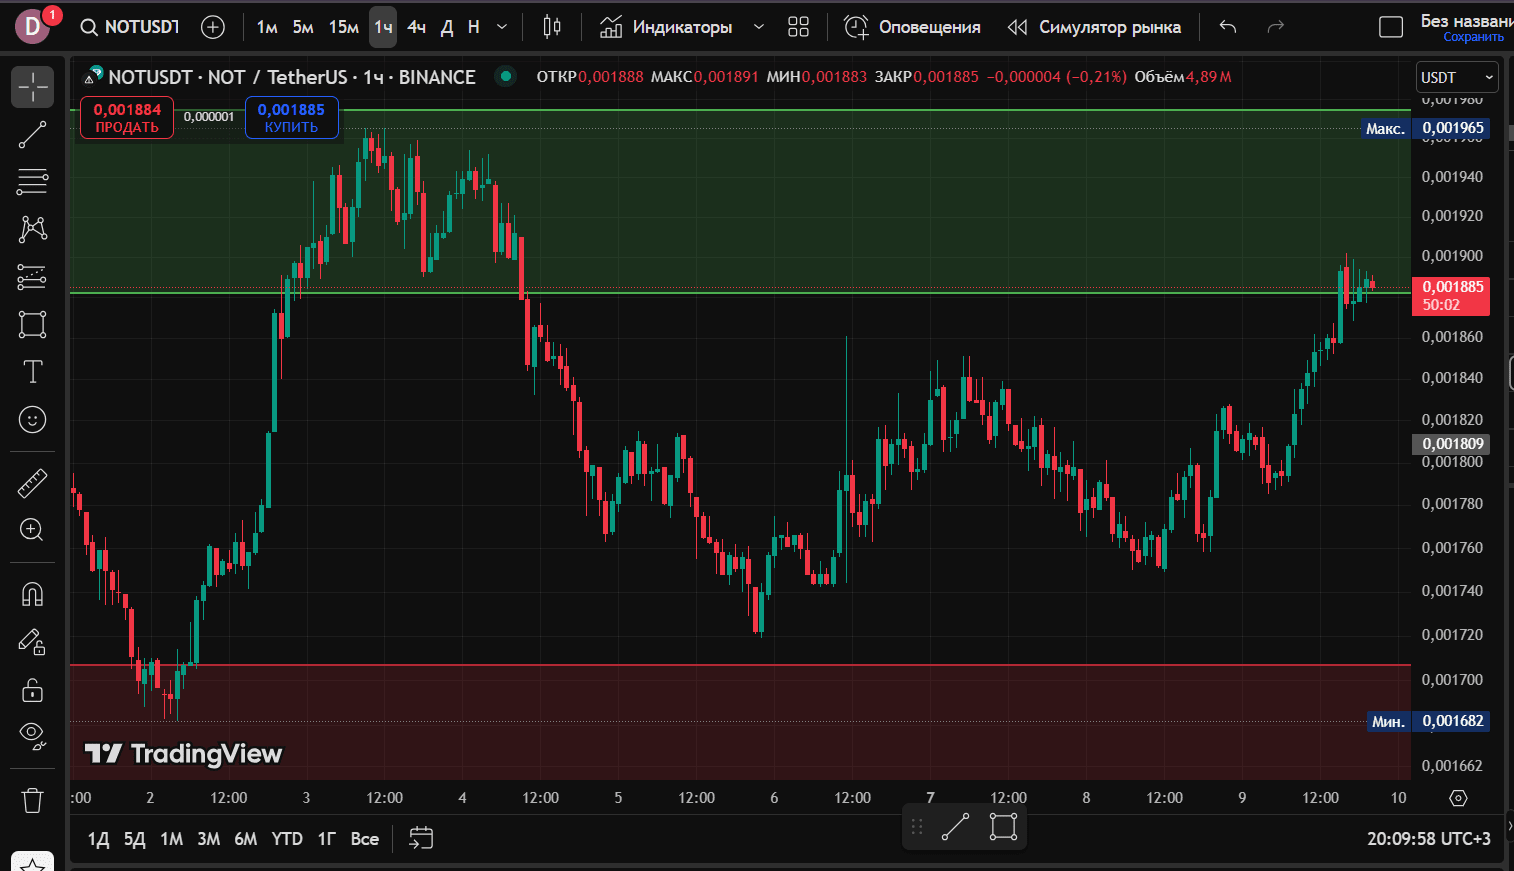
🟨 Local resistance (H1–4H): ~$0.00190–0.00200
On smaller time frames, it can be seen how the price repeatedly bounced off this zone.
This is a short-term obstacle — important for scalping or intraday trading.
🧠 How to apply?
📈 Scenario 1: long
Buy from the support zone ~$0.00160 upon confirmation on smaller time frames.
Targets: $0.00200, then $0.00300.
📉 Scenario 2: short
Sell from resistance $0.00340 upon weakness on approach.
Target — return to support or local zone.
💥 Scenario 3: breakout
Wait for consolidation above $0.00340 → enter long on the retest.
Target — zone 3 ($0.00550–0.00620).
📌 Conclusion
Levels are the foundation of technical analysis.
They help to understand:
Where the interests of large players lie;
Where to open positions with the least risk;
Where it makes sense to take profits.
🔧 Current zones for today on NOT/USDT:
Support: ~$0.00160
Key resistances: ~$0.00300 and ~$0.00550
Local resistance: ~$0.00190–$0.00200
💬 Working with levels allows us to build understandable scenarios and avoid trading 'blindly'.
🚫 This is not financial advice, but just my view on the structure and analysis of the chart. Always DYOR and consider your risks. 😉
#NOT
#notcoin
#priceaction
#УчимсяВместе
