1. Multi-timeframe Analysis
1. Daily level (trend direction anchoring)
Trend Status:
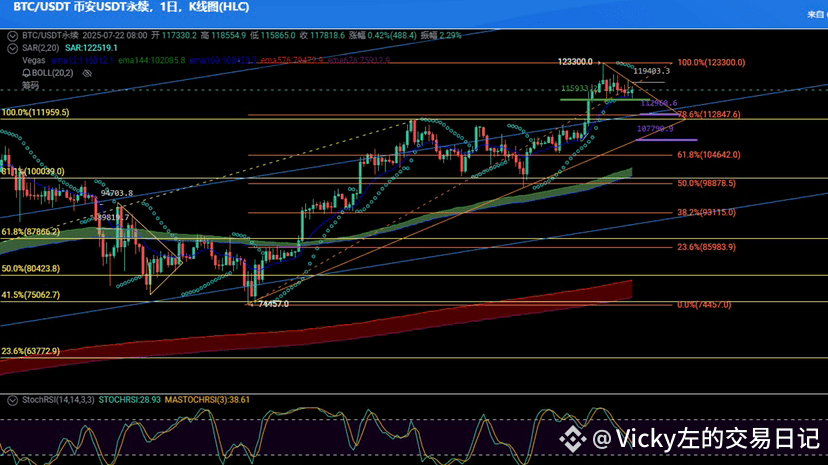
Price breaks below EMA30 ($117,500), forming bearish pressure, MACD death cross continues, RSI (42) neutral to bearish.
Key Resistance Level: $118,300 (EMA30 + Bull-Bear Divide), breaking is needed to relieve downward pressure.
Key support level: $116,600 (July low), if broken, it may accelerate to $114,800 (200-day moving average).
2. 4-hour level (trading signal trigger)
Pattern Signal:
After the symmetrical triangle breaks down, the lows continue to move down ($117,500 → $116,128), Bollinger Bands open downwards (lower band at $116,000).
Wedge structure lower support: $114,000 (coinciding with daily 38.2% Fibonacci retracement), if it stops falling, it will trigger a second rebound.
Volume verification: A rebound needs to break $118,300 with increased volume (one-hour trading volume > $2.5 billion), otherwise considered a false breakout.
3. 1-hour level (catching entry timing)
Momentum Structure:
RSI (45) not oversold, OBV energy flow continues to weaken, short-term resistance at $117,800 (EMA10 dynamic resistance).
Support at $116,600 tested multiple times, breaking will trigger programmed selling.
⚔️ Second, Trading Strategy
Strategy 1: Short on Rebound (Main Strategy)
Entry Conditions:
Price rebounds to the $117,800–$118,300 range (daily EMA30 + 4-hour wedge upper resistance), and shows signs of stagnation (such as doji, RSI overbought).
Specific Operations:
Entry Point: Build positions in batches, first position at $117,900, add at $118,200 (total position ≤8%).
Stop Loss: $119,000 (breaking the upper wedge + previous high resistance).
Take Profit Target:
Target Levels Price Range Logical Basis Position Allocation
First Target $116,600 Support zone at July low 60% profit taking
Second Target $115,200–$114,800 200-day moving average + Short liquidation zone 30% profit taking
Dynamic Tracking Trailing Stop to Lock in Profits Move stop loss down 0.8% for every 1.5% drop Keep 10%
Strategy 2: Steady Buying on Dips (Secondary Strategy)
Entry Conditions:
Price retraces to the $114,800–$115,200 range (200-day moving average + daily 38.2% retracement), and the candlestick closes with a long lower shadow or bullish engulfing pattern.
Specific Operations:
Entry Point: Light long position at $115,000 (3%-5% position), stop loss at $113,800 (1% below strong support).
Take Profit Target:
First Target $117,500 (4-hour EMA30), take profit 50%;
Second Target $119,000 (upper wedge), take profit on remaining positions.
⚠️ Three, Risk Control and Dynamic Adjustment
1. Key Risk Alerts
Event-Driven:
Federal Reserve interest rate decision (announced today): If hawkish signals are released (such as 'delayed rate cuts'), it may trigger liquidity tightening, need to reduce positions by 50% in advance.
Whale Selling: On-chain monitoring detected 700 WBTC transferred to exchanges (valued at $82.4 million), if continuous selling pressure persists, it will strengthen the bearish trend.
Technical Failure Signal:
If the price breaks through $119,000 and holds for over 4 hours, close short positions and switch to long (target $121,000).
2. Position and Leverage Management
Total Position: Single strategy ≤8% of total capital, independent positions for dual strategies.
Leverage Limit: ≤3 times (to prevent policy black swan), avoid increasing positions before and after Federal Reserve decisions.
3. Liquidity Verification Indicators
Resistance Strength: $118,300 piled with 2,500 BTC sell orders, breaking requires whale short covering > 1,800 BTC.
Support Strength: $116,600 with 1,000 BTC buy orders, breaking will trigger a 2,200 BTC level long liquidation.
💎 Four, Summary and Operational Discipline
Core Logic: Daily bearish dominance + 4-hour wedge breakdown, main strategy focuses on shorting rebounds targeting $114,800; secondary strategy to build long positions at $114,800–$115,200 for potential second high.
Strict Risk Control:
Event-sensitive period (Federal Reserve decision) will tighten stop loss to cost price;
Use trailing take profit (e.g., move stop loss down 0.8% for every 1.5% drop) to lock in profits.
Data Monitoring Focus:
On-chain whale outflow (> 1,500 BTC to exchanges warning of selling pressure);
Binance funding rate (>0.007% pause shorting);
Option market changes in open interest for $115,000 put contracts.
Strategy Dynamic Adjustment: If the price falls to $114,000 and shows a 'diamond bottom' structure (hourly RSI divergence + increased bullish volume), switch to trend long position targeting $130,000.