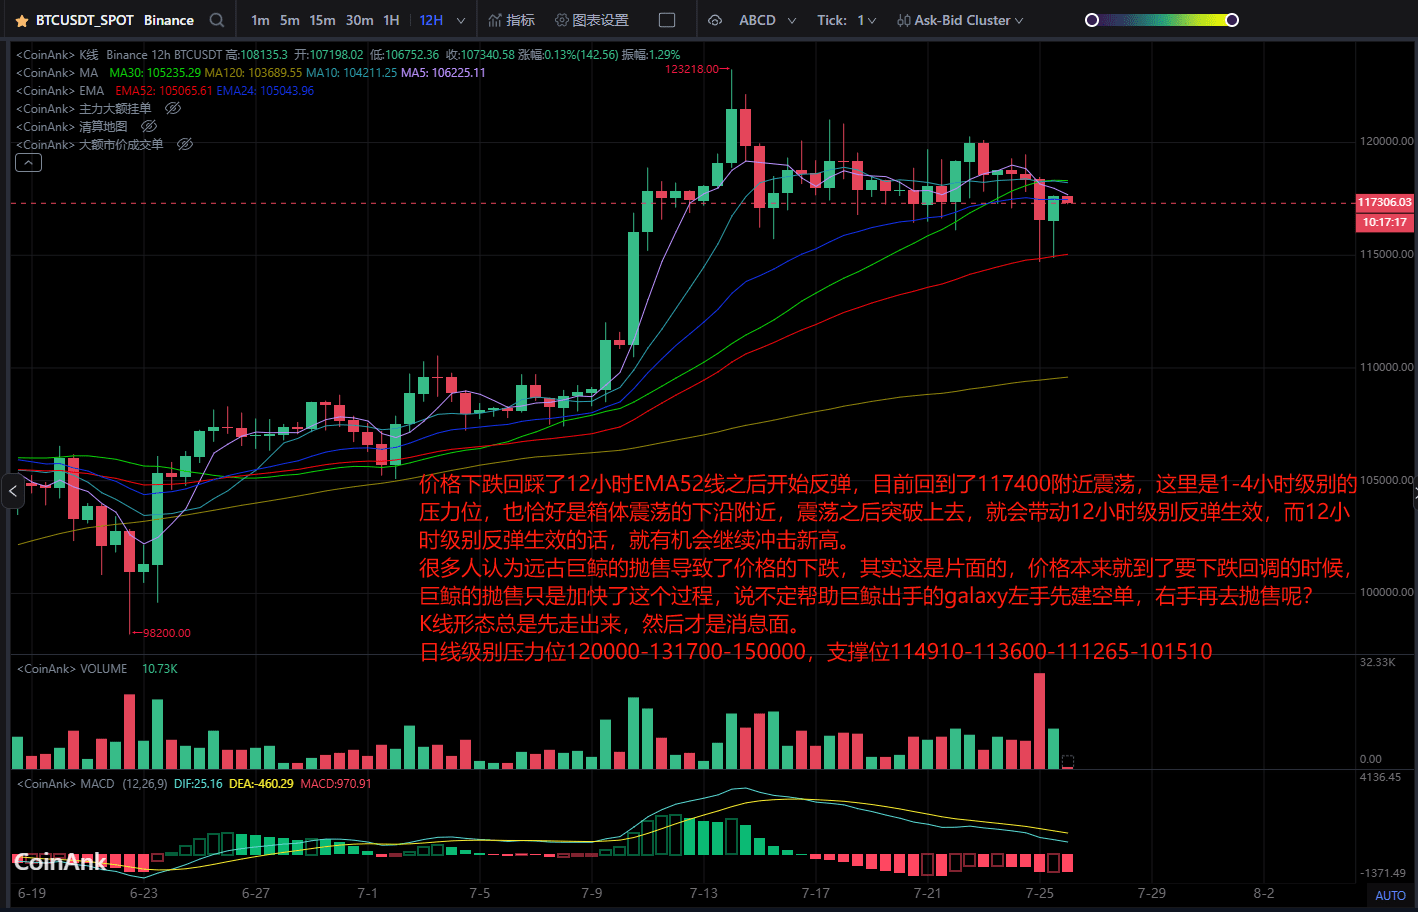
After the price dropped and retraced to the 12-hour EMA52 line, it started to rebound. It is currently fluctuating around 117400, which is a resistance level on the 1-4 hour chart, and it happens to be near the lower edge of the range. If it breaks upward after this fluctuation, it will initiate a rebound on the 12-hour level. If the 12-hour rebound is effective, there will be a chance to continue to challenge new highs.
Many people believe that the sell-off by ancient whales caused the price to drop, but this is one-sided. The price was already at a point where it needed to drop back, and the sell-off by whales just accelerated this process. Perhaps the whales were helped by Galaxy, who first built a short position with their left hand and then sold with their right hand?
Candlestick patterns always emerge first, followed by news.
Daily resistance levels 120000-131700-150000, support levels 114910-113600-111265-101510