Let's analyze this chart for the PI#/USDT# pair.
Technical indicators analysis:
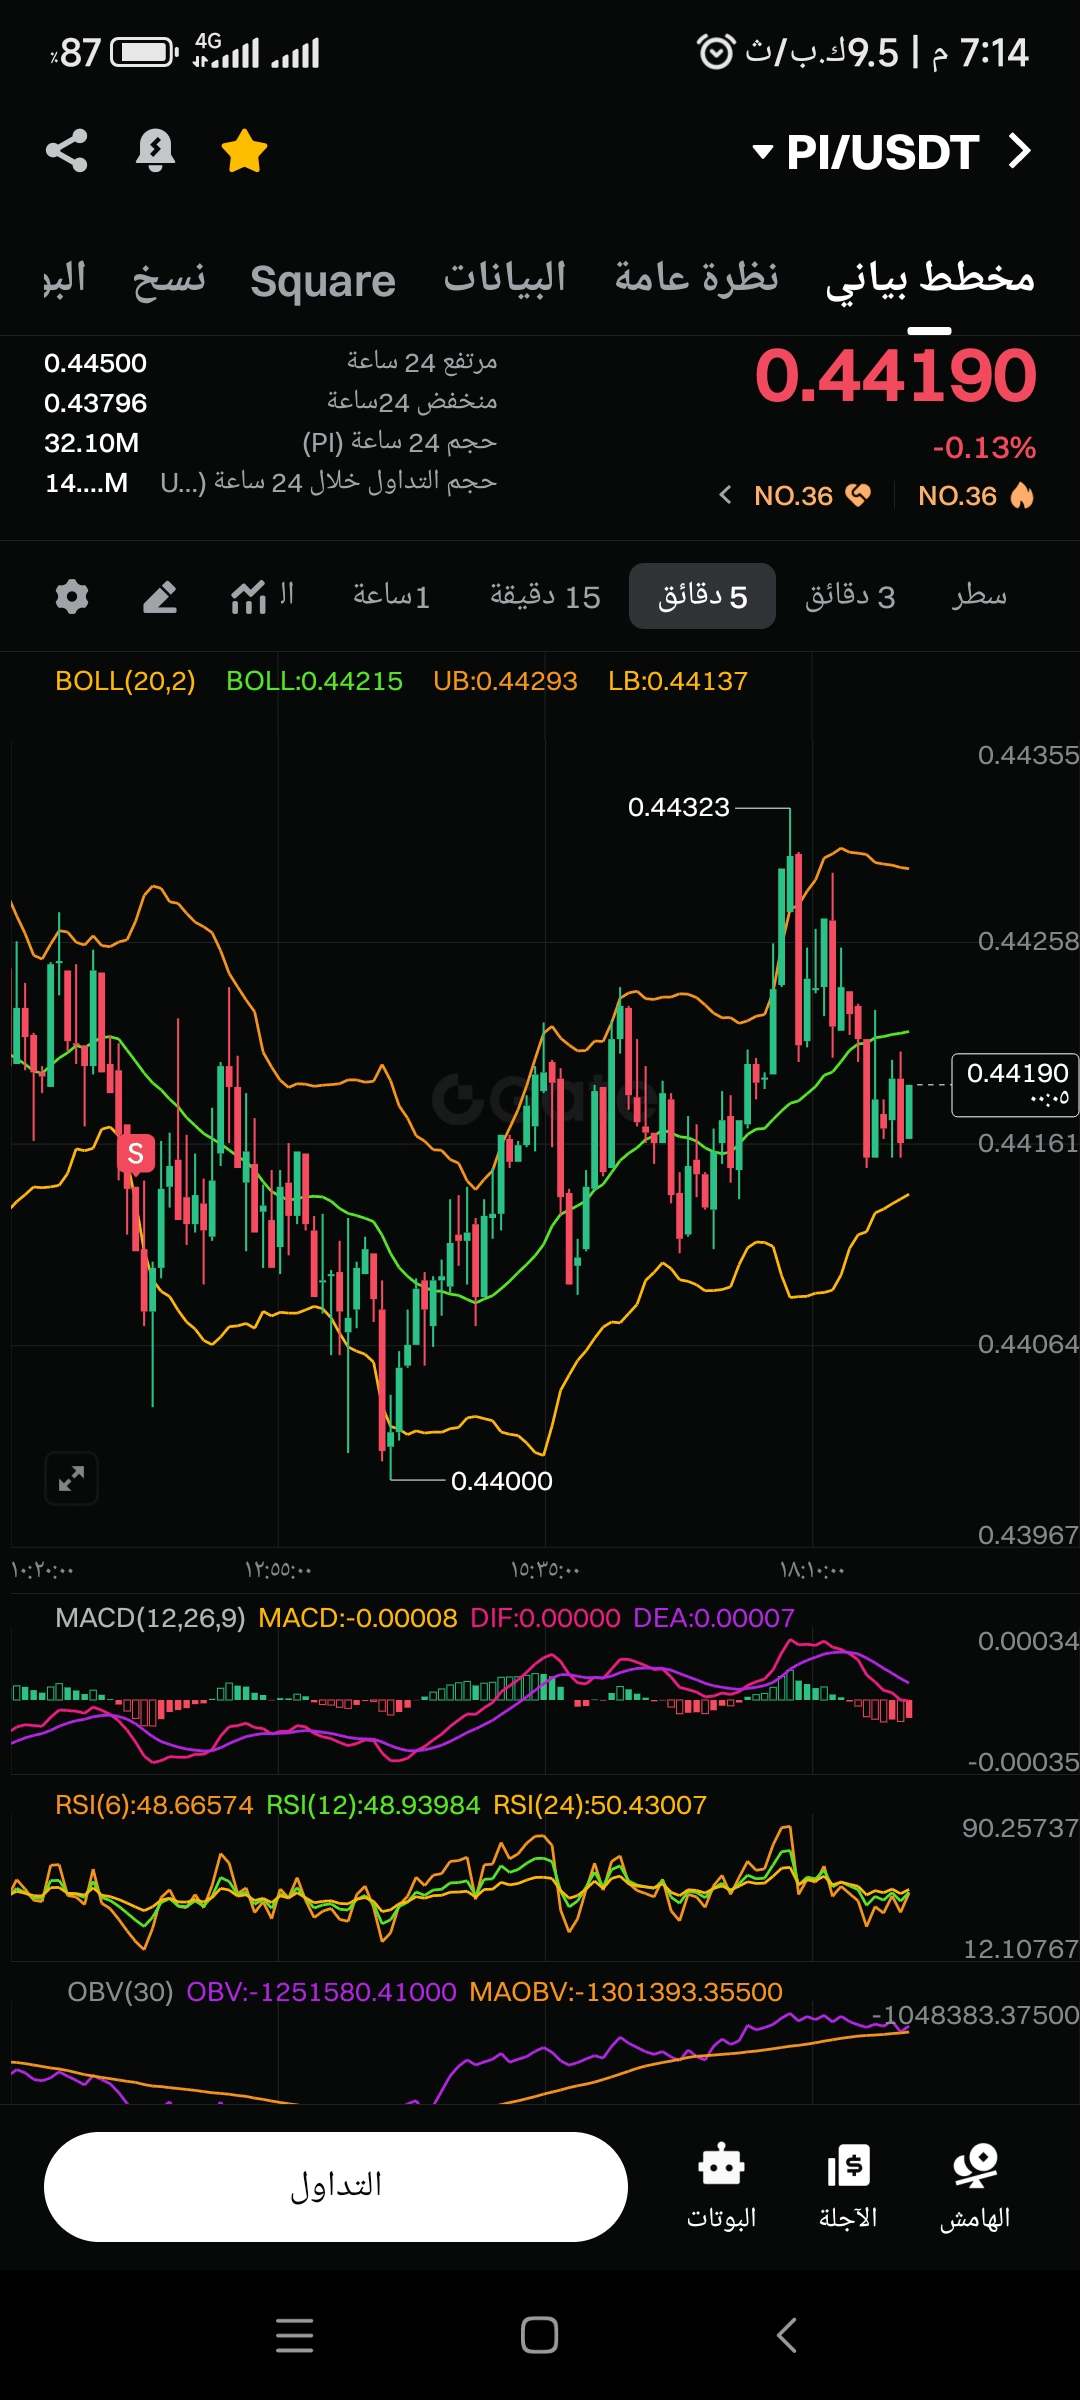
* Bollinger Bands Indicator (BOLL(20,2)):
* The current price (0.44171) is between the middle limit (BOLL:0.44214) and the lower limit (LB:0.44134).
* The bands are relatively narrow, which may indicate a period of consolidation or low volatility.
* The price is attempting to rebound from a zone near the lower limit, which may indicate potential support.
* MACD Indicator (MACD(12,26,9)):
* MACD line (-0.00009) is very close to the signal line (DIF:-0.00001) and DEA line (0.00007).
* The lines are converging closely and may be about to cross, but currently show weakness in upward momentum.
* The negative MACD value indicates bearish control, but it is close to zero which may indicate an imminent change.
* Relative Strength Index (RSI(6), RSI(12), RSI(24)):
* RSI(6): 42.06284
* RSI(12): 45.84635
* RSI(24): 48.90517
* All RSI values are below 50 but are not in the oversold area (below 30).
* This indicates that momentum is not strong in either direction, but it is slightly leaning toward a decline.
* On-Balance Volume Indicator (OBV(30)):
* OBV: -1272151.83000
* MAOBV: -1302079.06900
* OBV is below its moving average (MAOBV) and shows negative values, indicating that selling pressure is greater than buying pressure and that volume does not support the upward movement.
Additional notes from the chart:
* Current price: 0.44171.
* Highest price in 24 hours: 0.44500.
* Lowest price in 24 hours: 0.43796.
* Trading volume in 24 hours: 32.07M PI, which is relatively good volume.
* The chart is on a 5-minute timeframe, which means it gives a very short-term signal.
Conclusion and recommendation before entering a buy trade:
Based on the current analysis:
* Discouraging signals for immediate buying: MACD and OBV indicators do not support a strong buy trade at this time, as they show weakness in upward momentum and selling pressure.
* RSI: Not in the oversold area to indicate an imminent rebound.
* Bollinger Bands: The price is approaching the lower limit, which may provide support, but the rebound has not yet been confirmed.
* Timeframe: The 5-minute timeframe makes you susceptible to short-term fluctuations.
Tips before making a decision:
* Wait for confirmation: Do not enter a buy trade unless you see strong confirmation signals. For example:
* Clear bullish crossover in MACD.
* Notable increase in OBV.
* The price has firmly breached the middle limit of the Bollinger Bands.
* RSI rises above 50.
* Monitor trading volume: Ensure that any upward movement is supported by strong trading volume.
* Look at larger timeframes: Before entering a buy trade, it is always good to look at larger timeframes (like 15 minutes, 1 hour, 4 hours) to get a clearer picture of the overall trend and avoid falling into short-term traps.
* Identify entry and exit points: Determine your entry point based on confirming signals, a stop-loss point to protect your capital if the market goes against you, and a take-profit point.
* Risk: Remember that trading cryptocurrencies is risky. Do not invest more than you can afford to lose.
In the current situation, it's better to wait and monitor the chart for stronger and more confirmed buy signals.