Analysis and forecasts for the price of SOL currency
Current analysis:
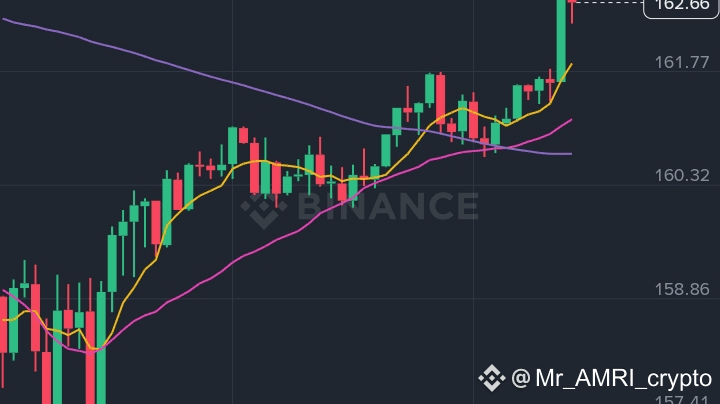
Price: The current price of SOL is $162.66.
Trend: The chart shows a strong upward trend in the short term.
Moving Averages (MA):
MA(7) at 161.88.
MA(25) at 161.16.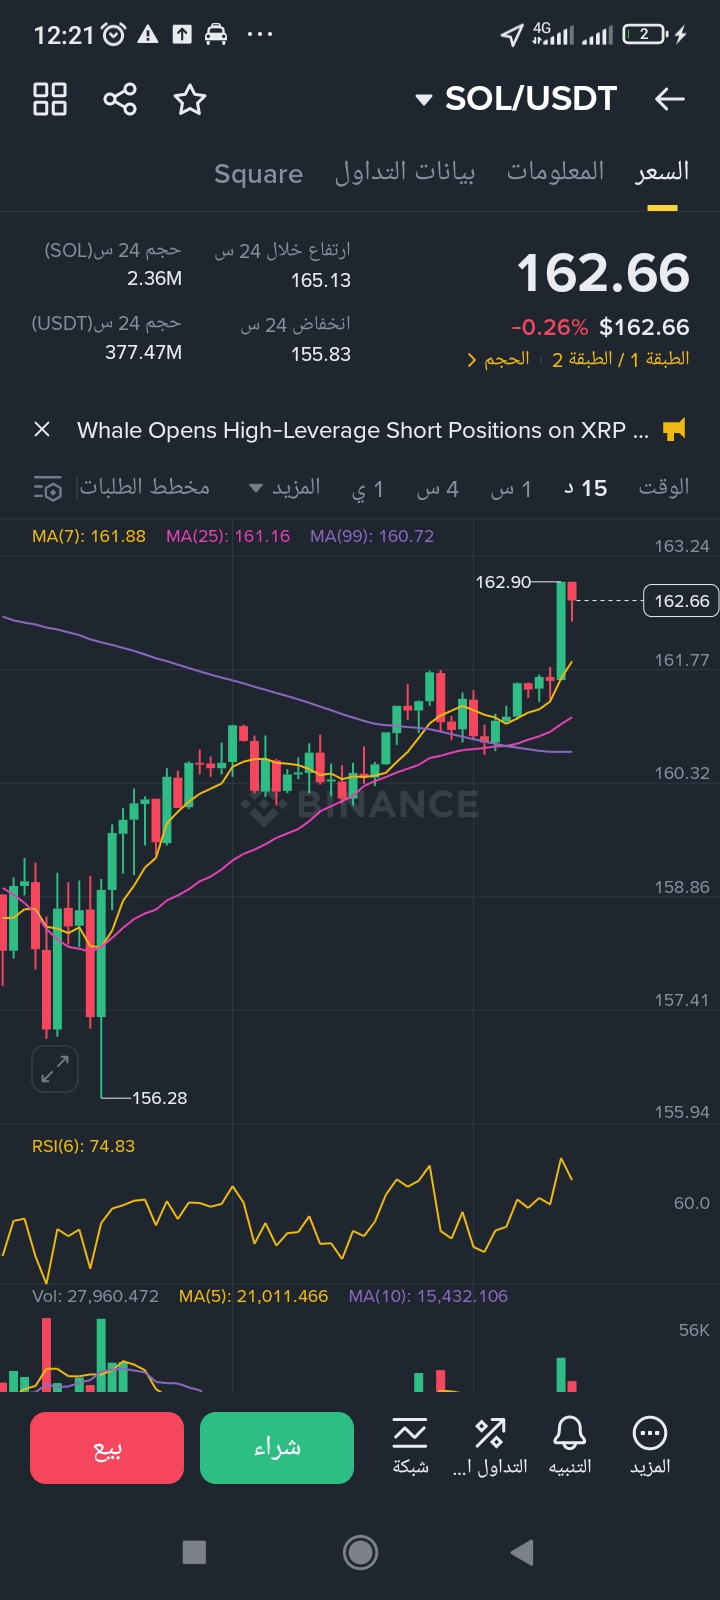
MA(99) at 160.72.
The price is trading above all moving averages, confirming the strong upward momentum. The moving averages themselves are arranged in an ascending order (MA(7) > MA(25) > MA(99)), which is known as the "Golden Cross" in its early stages, reinforcing the bullish outlook.
Relative Strength Index (RSI): The value of RSI(6) is 74.83. This indicator is very close to the "overbought" zone, which typically starts at 70. This suggests that the price may be due for a correction or a slowdown in the rise at any moment.
Volume: The current volume (Vol) is 27,960.472, which is much higher than the moving averages of volume (MA(5) and MA(10)). This strong increase in volume during the rise confirms the strength of the current upward movement.
Resistance and Support:
The nearest clear resistance is the current price peak at around 163.24. Breaking this level will open the door for new highs.
The nearest support areas are the moving averages, especially MA(7) at 161.88, then MA(25) at 161.16, and finally MA(99) at 160.72.
Forecast:
Bullish Scenario:
With strong upward momentum supported by volume, it is expected that the price will attempt to test and break the resistance level at 163.24.
If it successfully breaks this level, it may continue to rise towards higher levels, but caution is advised as the RSI indicates that the price may be on the verge of a correction.
Bearish Scenario (Correction):
Since the RSI is in the overbought zone, it is likely that the rise will slow down or a price correction will occur.
In this case, the price may bounce from the resistance level or from the current levels and head towards support areas, such as the moving averages at 161.88 or 161.16.
Any correction may be considered healthy if the price bounces from these levels and continues to rise.
If the price drops below MA(99) at 160.72, it could be a signal of a trend change.
General tips for traders:
Be cautious with RSI: The relative strength index in the overbought zone is a warning sign. If you're considering buying, it may be better to wait for a correction.
Use stop-loss orders: With strong momentum, sharp movements may occur. Using stop-loss orders is crucial to protect capital.
* Follow trading volume: Although the current volume is strong, pay attention to any sudden drop in volume while the price attempts to break resistance, as this may be a sign of weakness in the movement.