The cryptocurrency market is witnessing notable momentum for Stellar Lumens$XLM , as the currency moves in an upward path supported by strong technical signals and fundamental news that may drive it to break through important resistance levels in the coming days.
Technical Analysis – A Look at Candlesticks and Indicators
Current Price and Market Movement
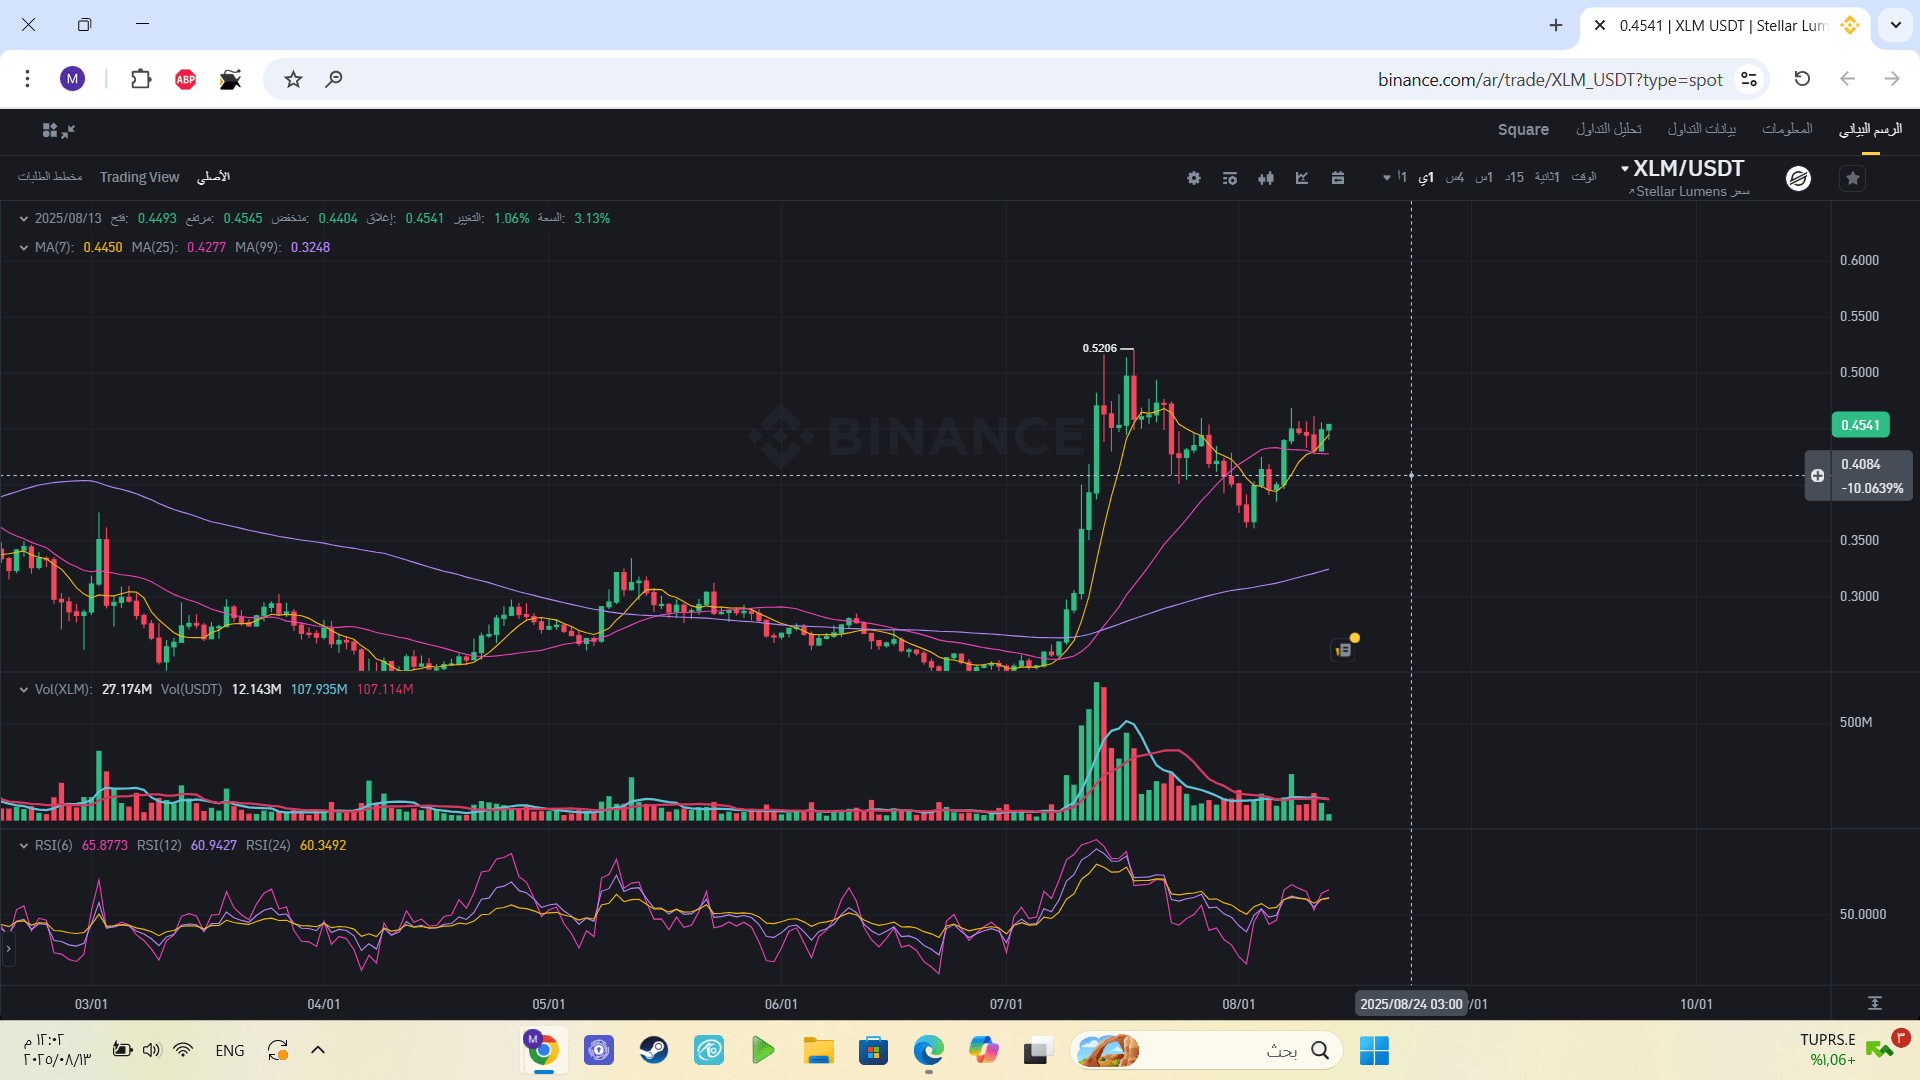
Currently trading at$XLM $0.4499 with an increase of +3.28% over the last 24 hours, recording a daily high of $0.4560 and a low of $0.4306.
Moving Averages and Momentum
MA(7): 0.4444
MA(25): 0.4276
MA(99): 0.3248
Maintaining the price above short and medium-term averages confirms the continuation of the upward trend in the near term.
Chart Patterns
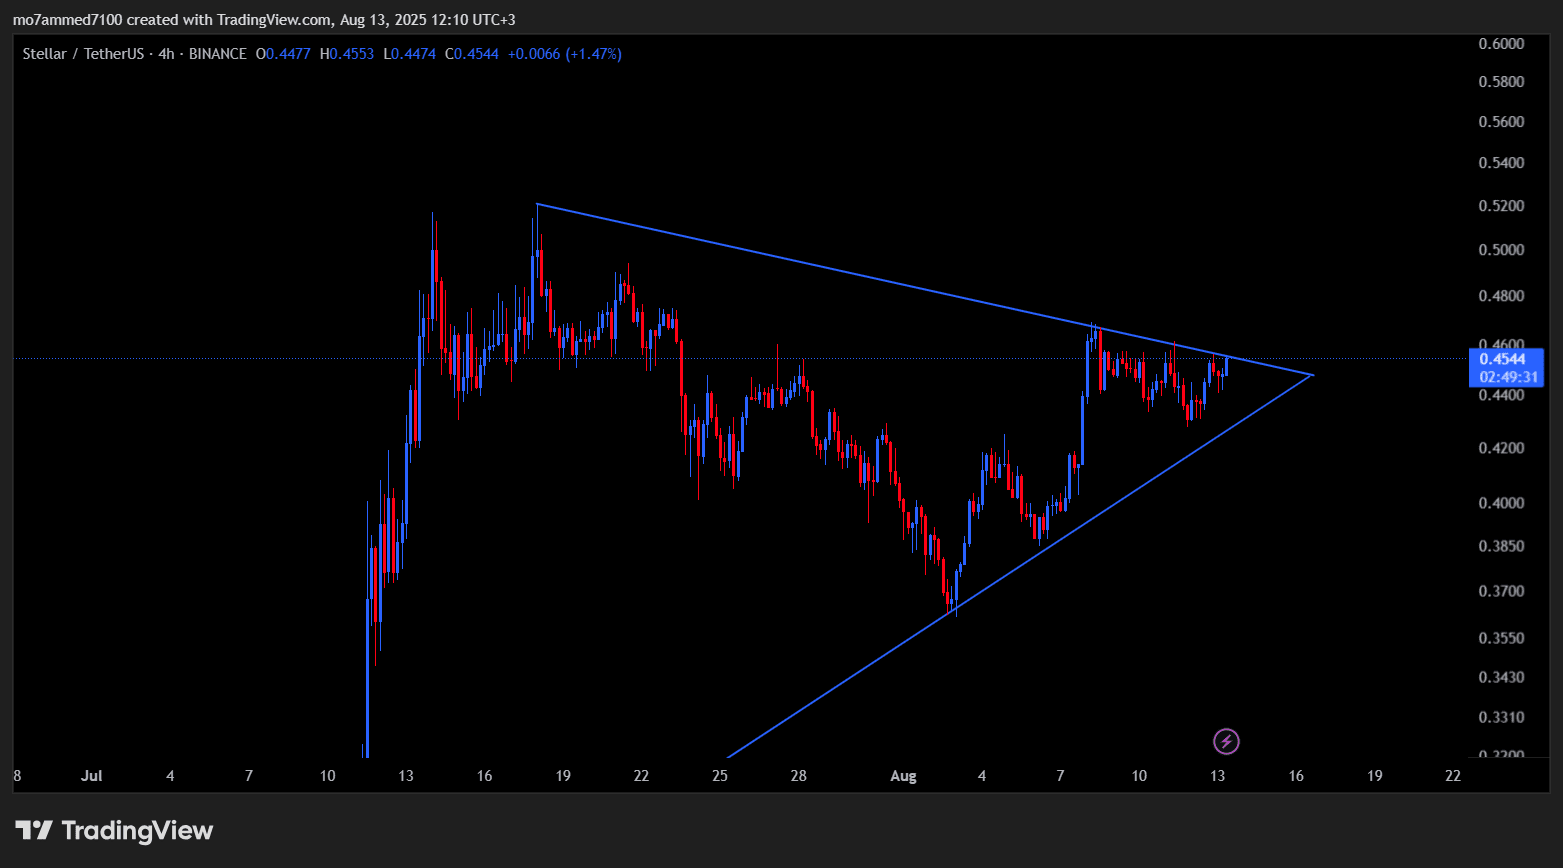
Bullish Flag breakout on the 4-hour timeframe, opening the door to a target that may reach $0.75 if buying momentum continues.
Falling Wedge pattern has been broken upwards, enhancing the chances for continued rise towards horizontal resistance.
Strong resistance in the $0.47 range, and a close above it may trigger a bullish wave towards $0.50, possibly extending to higher levels.
Trading Volumes
Despite a relative decline in trading volume compared to July's peak, data indicates a relative buying control (53% buying vs. 47% selling), reflecting continued interest from buyers.
Fundamental Analysis – News and Techniques that Enhance Optimism
Protocol 23 Update
The Stellar network is preparing for the technical upgrade Protocol 23, with the beta version launching on August 14 and the vote for the main release on September 3. This upgrade could enhance performance and increase network adoption in institutional transactions, especially with its compliance with the ISO 20022 standard for cross-border payments.
Market Performance and Indicators
Since August 8, the price of XLM has risen by 15%, maintaining support at $0.42, with the RSI indicator at 57.56, reflecting balanced momentum in favor of buyers.
Price Forecasts
In the near term: Range of $0.44 – $0.56, with an expected average of $0.475 (+17% potential).
In the medium term: Possibility of reaching $0.60 – $0.70 if positive signals continue until October.
Possible Scenarios
Bullish Scenario: A close above $0.47 will enhance the likelihood of testing $0.50, and with a breakout of this level, we may witness a wave of rising towards $0.60 – $0.75.
Pullback Scenario: A break below the $0.42 level may lead to a wider correction, but the overall trend will remain positive as long as the main supports hold.
Inspiring Summary
Stellar Lumens today possesses the perfect blend of technical support, buying momentum, and fundamental catalysts, making it a strong candidate to test the $0.50 level and perhaps exceed it. With the significant technical upgrade approaching and the emergence of bullish chart patterns, the coming days could be a golden opportunity for investors and followers.
Stay close to the chart, as we may soon witness a new breakout that makes XLM the focus in the cryptocurrency market.
The information and analyses contained in this article are for educational and informational purposes only and do not constitute investment advice or a recommendation to buy or sell. Trading cryptocurrencies involves high risks and may lead to complete loss of capital. Readers are advised to conduct their own research and consult a qualified financial advisor before making any investment decisions. The author and the platform are not responsible for any losses or damages arising from reliance on the content herein.
#XLM #ETHRally #stellar #StellarLumens