
Five minutes to get you started, but true understanding requires a long time.
This is my first article on technical indicators. It may be relatively simple at the beginning, but the technical indicators involved later may become more complex. The reason for writing this column is firstly to organize relevant knowledge for myself, and secondly to try to provide some reference for friends who are trading, to motivate each other.
I believe the vast majority of traders' first technical indicator is the moving average, and there are many applications derived from moving averages, such as using moving averages as stop-loss points, dual moving average crossover, and the arrangement of three moving averages (bullish arrangement, bearish arrangement), etc. However, today we are not discussing the specific uses of moving averages, but rather their construction methods.
We open the technical indicators in TradingView, select the simple moving average, and then in the upper left corner (default) of the chart, we can see SMA. Hover the cursor over this technical indicator, and a screw icon appears for 'settings'. After opening it, in the first column under 'Smoothing', there is a drop-down menu, and after clicking it, you can see:
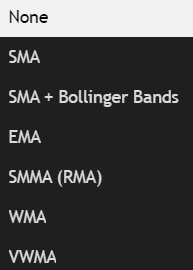
For now, we will not discuss the use of Bollinger Bands. Let's take a look at what SMA, EMA, SMMA (RMA), WMA, and VWMA are.
In terms of data, we selected 5 data points, from the ETH closing prices on August 15th from 19:00 to 23:00 in the UTC+8 time zone, as follows:

The window length N for the moving average is set to 3, so we can obtain 3 data points for each type of moving average.
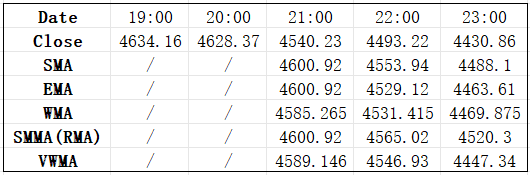
SMA: The simplest way to construct a moving average, arithmetic mean, giving equal weight to each data point, i.e., 1/N. It is easy to find that the three SMA data points are 4600.92, 4553.94, 4488.10.
EMA: Exponential Moving Average, constructed as EMA = α * close + (1-α) * EMA[-1]. α = 2 / (N+1). EMA[-1] is the EMA value from the previous day, while the first day's EMA value is directly taken as a simple average in TradingView. The characteristic of this method is that newer prices have greater weight, making it more sensitive than SMA.
WMA: The closing prices of the most recent N candlesticks are weighted by 'linearly decreasing' averages, meaning newer prices have greater weight, and the total weight equals 1. The denominator is the arithmetic series from 1 to N, which is 1+2+3=6 here. Today's numerator is N, decreasing by 1 as we go backward, thus the WMA at 21:00 is WMA = 3/6 * 4540.23 + 2/6 * 4628.37 + 1/6 * 4634.16 = 4585.265, and so on, with the remaining two values being 4531.415 and 4469.875. The feature is that it reacts more sensitively than SMA and is simpler in construction than EMA.
SMMA (RMA): Similar to EMA, but the value of α is changed to 1/N. Similarly, we can calculate other values as 4600.92, 4565.02, 4520.3. The construction method of this indicator is the default smoothing method in ATR and RSI.
WMA: Volume Weighted Moving Average, similar to WMA, but it no longer requires calculating an arithmetic series, only needing to use their respective volumes as weights. The corresponding volumes for the five data points are 12.47K, 58.92K, 58.72K, 82.02K, 102.12K. Therefore, the first VWMA data is:

The remaining data are 4546.93 and 4447.34.
The final organized table is as follows:
The above are the common construction methods for moving averages. If you like it, feel free to follow.
