
In the context of the cryptocurrency market continuously experiencing strong fluctuations, many investors still hope that Bitcoin has completed its correction phase and is ready to enter a new bull cycle. However, based on analysis of on-chain data and the history of halving cycles, a more cautious scenario is gradually emerging: Bitcoin may continue to face downward pressure in 2026, with the cycle's bottom still ahead.
Time axis: The familiar psychological trap of the market
Historical data shows that Bitcoin $BTC never bottoms immediately after reaching a peak. In all three previous halving cycles, the period from the highest peak (ATH) to the cycle bottom has been relatively consistent.
Specifically:
After the 2012 halving, Bitcoin took about 406 days to complete the decline phase.
The 2016 cycle recorded a bottom after about 363 days from ATH.
While the 2020 cycle took about 376 days.
These numbers show that the market often needs more than a year to absorb all the selling pressure, redistribute assets, and form a new equilibrium price range.
If this time model is applied to the current cycle, the actual bottom of Bitcoin is likely to fall in the period from October to November 2026. This means that short-term recoveries in 2025-2026 may only be technical, rather than marking the beginning of a sustainable uptrend.
Price axis: Value area or the beginning of panic?
In addition to the time factor, the price axis plays an equally important role in determining the cycle bottom.
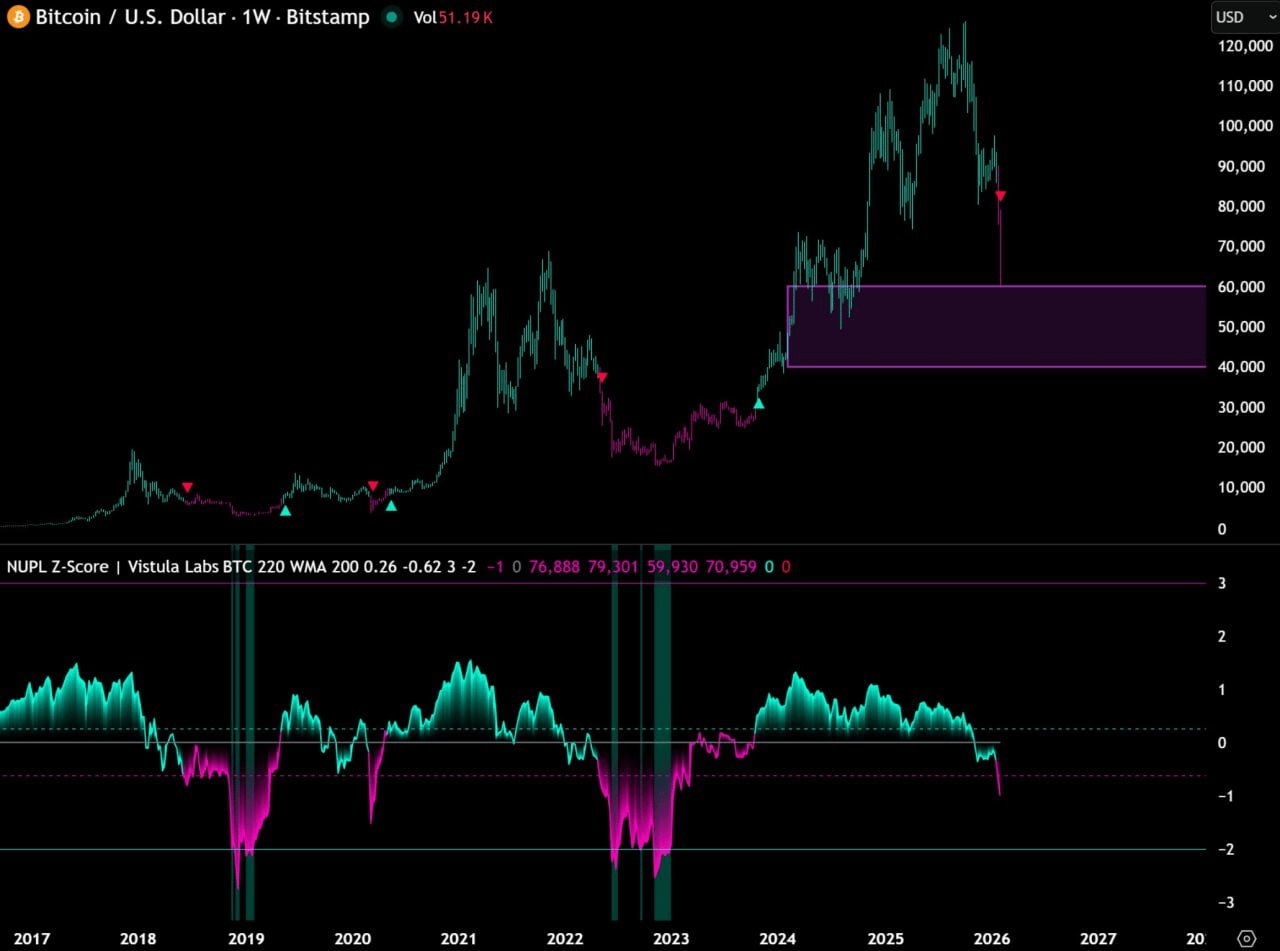
My strategy is to start accumulating when Bitcoin $BTC approaches the $60,000 area. Below this threshold, I consider it a strong buying zone, regardless of the time factor.

=> The market rarely gives investors the opportunity to buy at the absolute bottom, and gradually allocating capital according to high-probability price areas is often more effective than going "all-in" at a single point.
What does on-chain data say about the potential for deeper declines?
One of the important on-chain indicators is NUPL (Net Unrealized Profit/Loss), a metric that reflects the state of unrealized profit or loss of the entire market. In previous cycles, Bitcoin typically only bottoms when this index goes deep into the green area, associated with extreme fear and widespread capitulation.
At the current time, NUPL has not yet reached the historical bottom area. This indicates that latent selling pressure still exists, and the scenario of Bitcoin continuing to drop to the $45,000–$50,000 range by the end of 2026 is completely plausible, if history repeats itself.
From a long-term perspective, the most pessimistic market phases often coincide with large-scale asset transfer processes, as Bitcoin gradually leaves the hands of impatient investors to those willing to hold for the long term.
"The greatest opportunities often arise when the majority of the market is most fearful" - this perspective has been validated many times in Bitcoin's history. For investors who understand the cycle, deep declines do not equate to collapse but are an inevitable part of the process of re-establishing the foundation for the next growth cycle.