Weekly level: Although yesterday's price fell under the non-farm payroll news, and the market is extremely panicked, currently, we do not see the price breaking below the previous low around 1750 again, reason:
(1) According to the ABCD pattern, the current decline in segment AB is consistent with that in segment CD, both around 47%. The proportional decline segment where AB=CD has been completed.
(2) Last week's weekly chart showed a bullish Pinbar. What is a bullish Pinbar: First, the lower shadow is 2 times or more the body; secondly, it must be at a key support level, and it must have high volume. All of the above must be satisfied. If currently going long is solely based on the bullish Pinbar entry logic, one can enter at half the position of the lower shadow of the Pinbar, placing a stop loss at the bottom of the lower shadow. Yesterday's pullback low was around 1900, which is the 50% entry point of the Pinbar's lower shadow, so yesterday's first take profit point for ETH short position in the member area was around 1900.
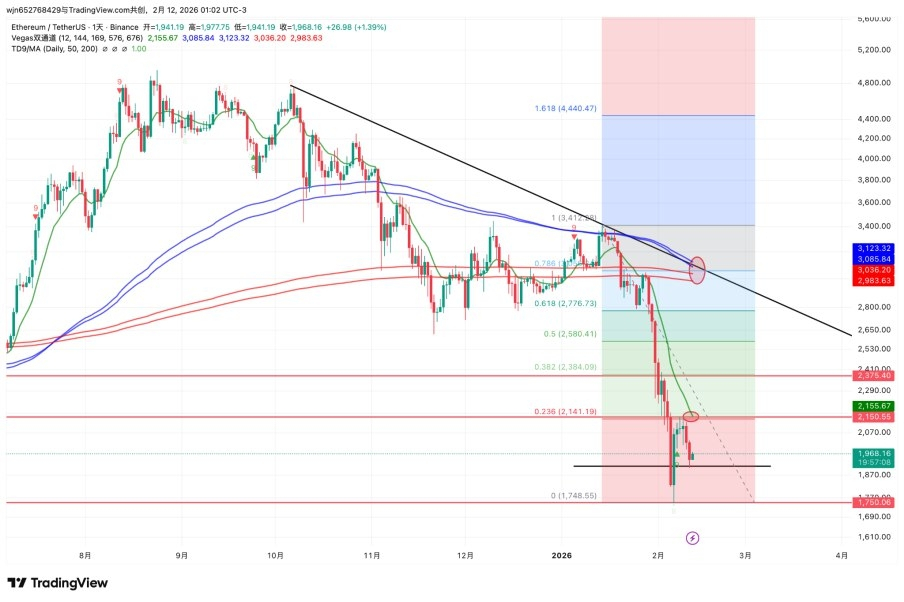
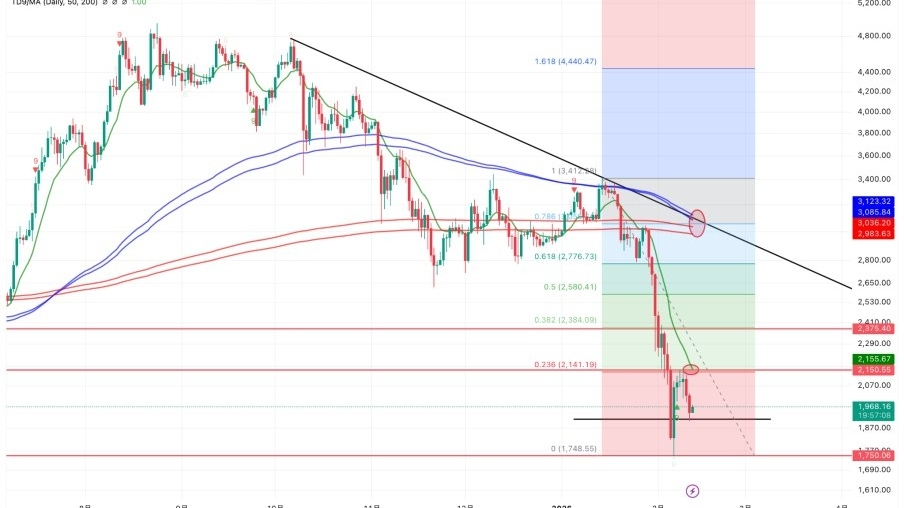
Daily level: The price is around 2150 with fibo0.236 resistance + Vegas ema12 resistance facing resistance, closing with a doji. The current price has two consecutive bearish candles. The 2150 resistance remains effective until the price breaks through it. If the price breaks through the first level of resistance at 2150, attention can be focused on the second level of resistance near fibo0.382 at 2400. Meanwhile, the FVG gap for ETH is between 2400-2600, and reaching 2400 can fill the gap.
Additionally, as the bottom oscillation time increases, the Vegas indicator will gradually move downwards to form a death cross. Therefore, at this stage, the bottom can be considered for a rebound without considering a drastic reversal. There is also no bottoming structure present, and the daily strategy continues to revolve around high selling and low buying, trying to avoid participation in the noise market when the price is in the middle.
On the indicator side, the RSI has been in the oversold zone, and there is an expectation of a bullish crossover in the MACD. The KDJ is oscillating around the midpoint, overall leaning towards a fluctuating upward trend.
binance rebate code VIPOFBN999#CPI数据来袭