Most people think trading is only for pros with years of experience. But here’s the truth — you can start small and still win. With just a 5-minute candlestick chart, you can spot quick opportunities and aim for up to $40 a day. 🚀

BTC
76,201.85
-0.74%

BNB
623.83
+0.15%
?$SOL

SOLUSDT
Perp
83.69
-1.00%
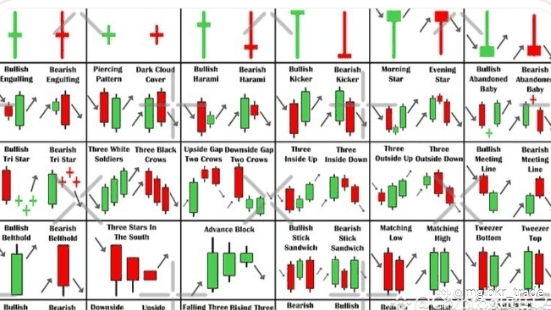
? What’s a 5-Minute Candlestick Chart?
It’s a chart where each candle shows what #RedSeptember #MarketPullback #RedSeptember #GoldPriceRecordHigh happened in just 5 minutes:
✅ Green = Price went up
❌ Red = Price went down
By watching how candles form, you can read the story of buyers and sellers — and predict the ne
xt move.