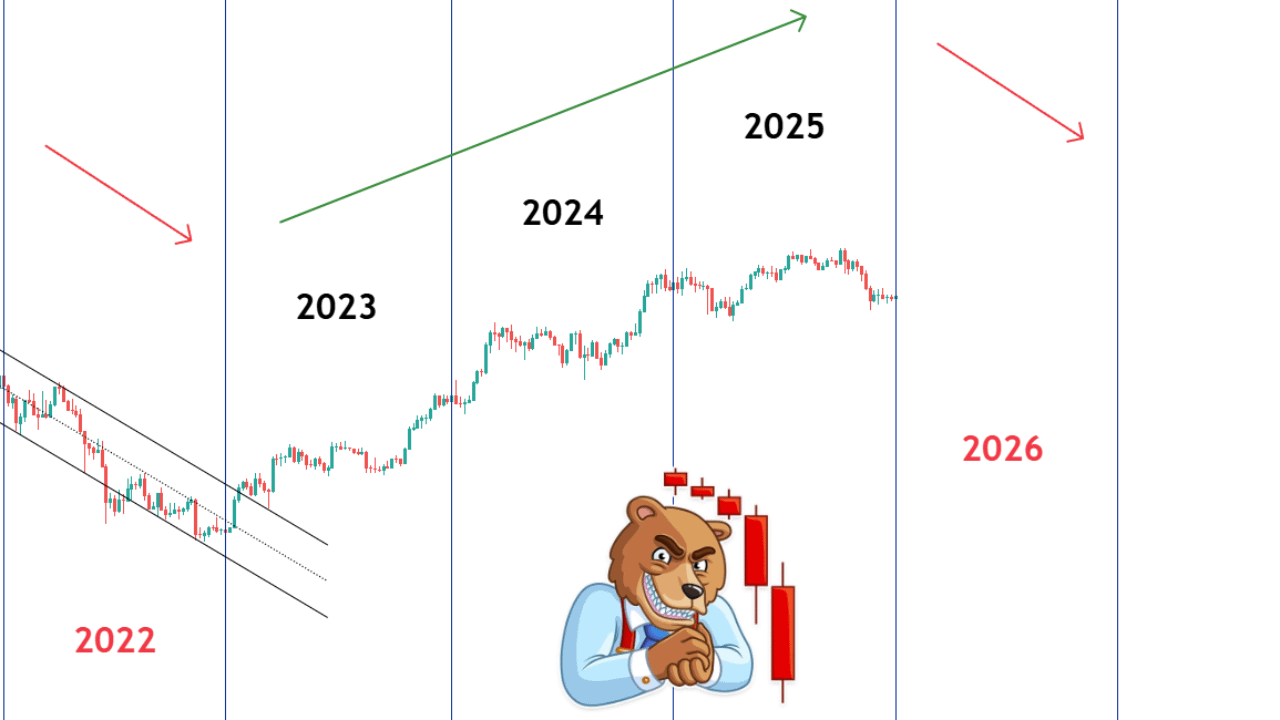
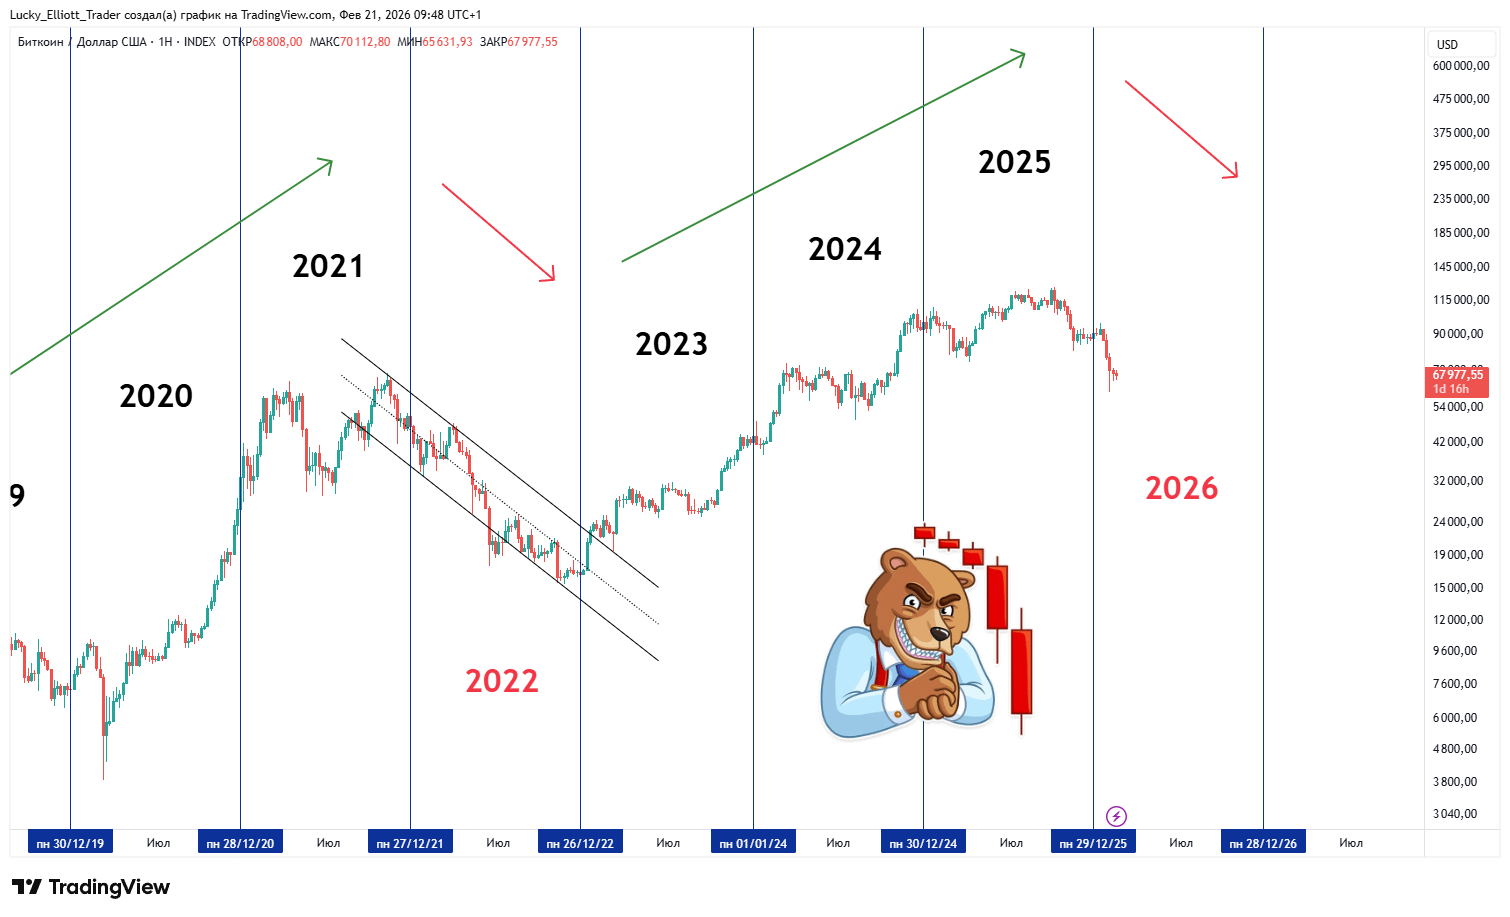
If we conditionally divide the entire existence of Bitcoin into 3 years of growth and 1 year of decline, forming one cycle, then the year 2026 will be another year of decline for the asset.
I noticed this feature in 2023 when I was studying and comparing the returns of Bitcoin with other types of assets.
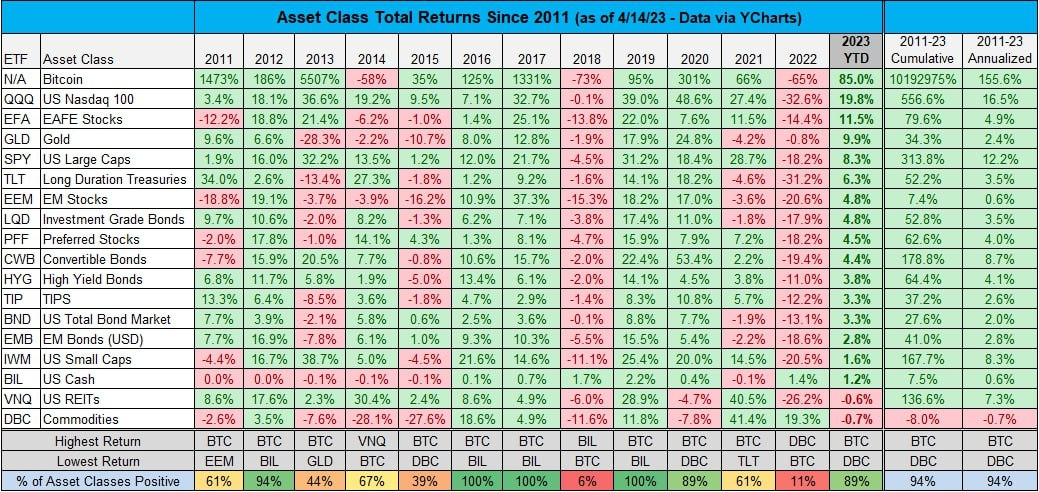
The chart clearly shows a certain cycle. The idea came to reflect this on the graph and see how cycles have historically alternated.
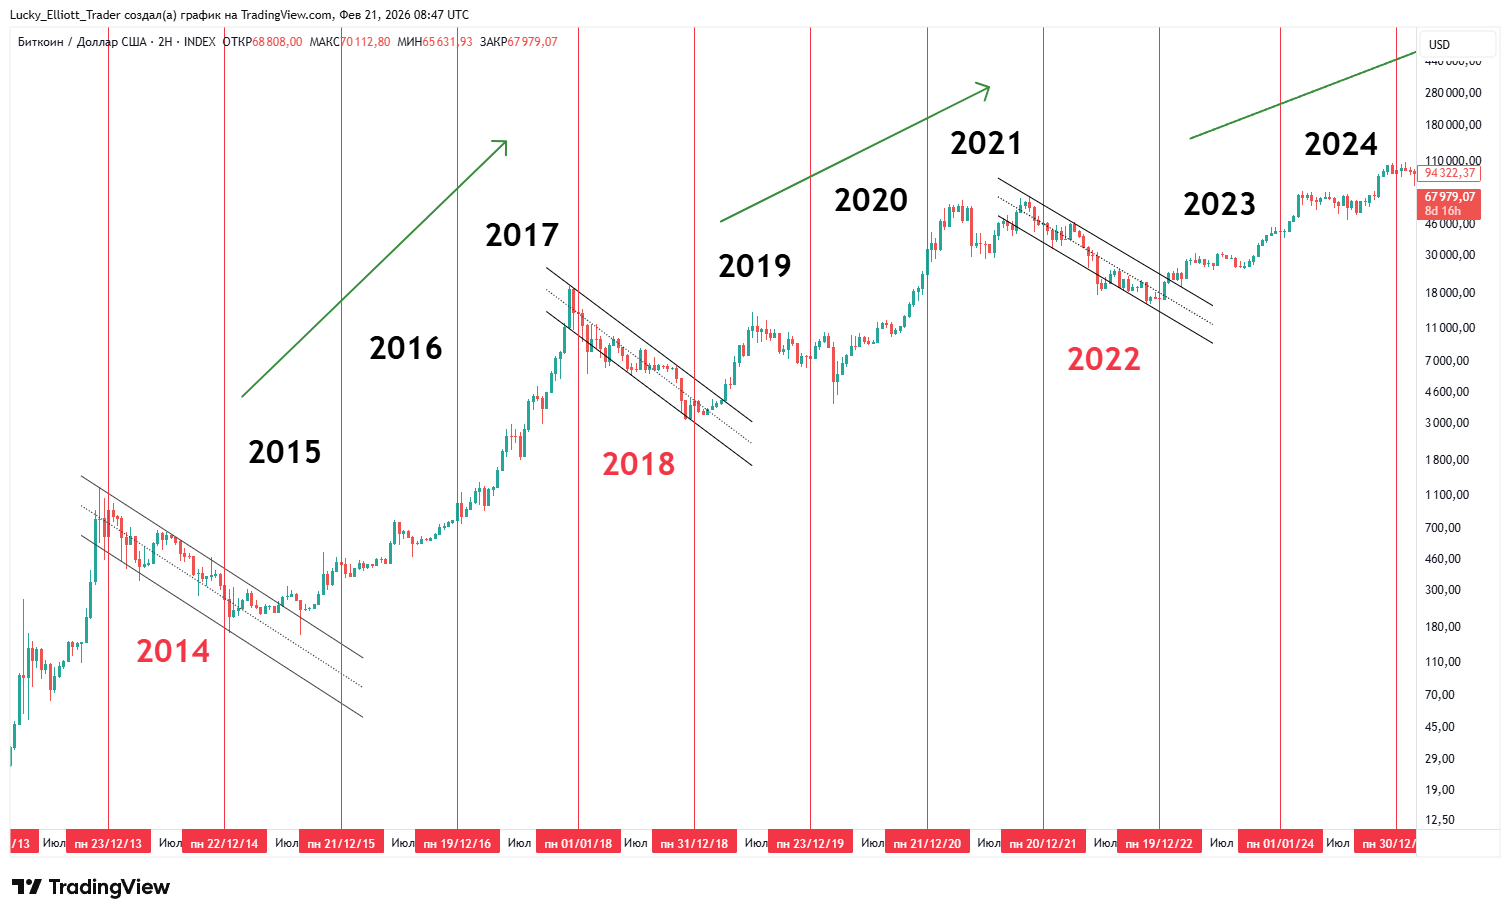
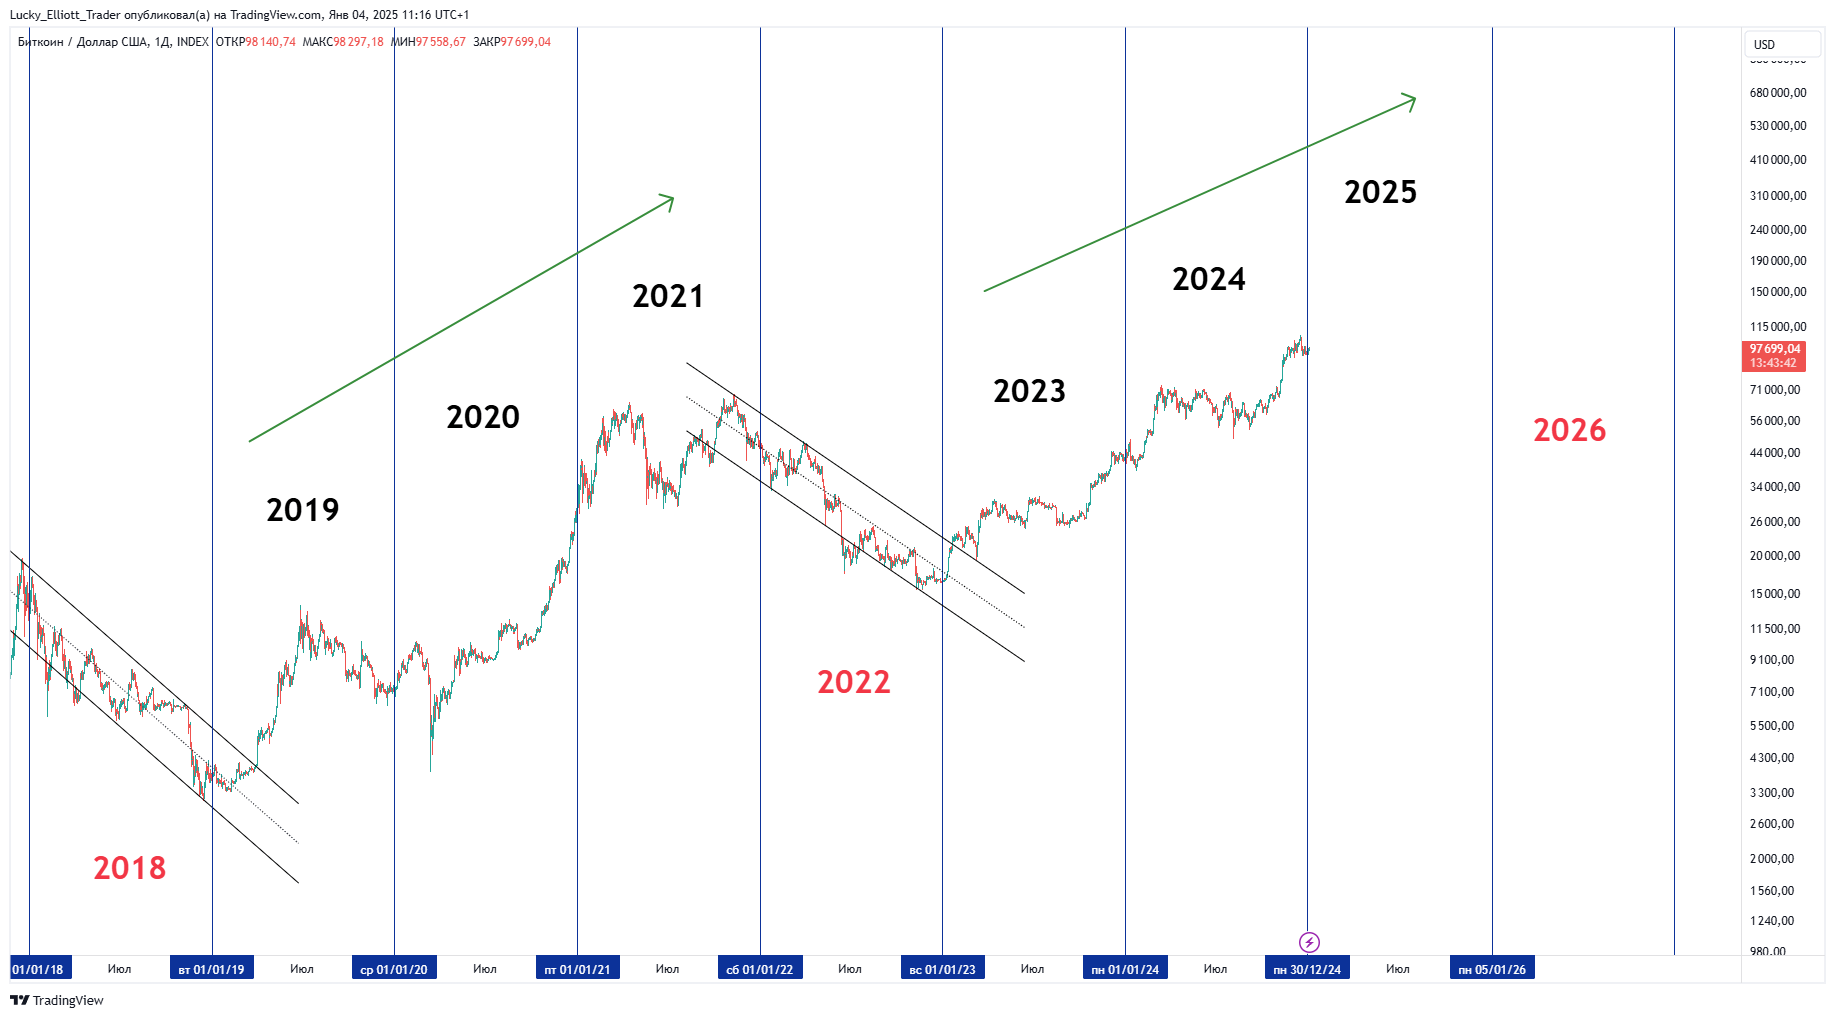
🧐 An interesting result was obtained. Besides the fact that the decline occurs exactly over the course of a year, it also develops in a descending channel. Already in January 2025, I understood that there would be a strong decline in Bitcoin in 2026, and 2025 would be the last year of growth in the cycle, when traders and investors could lock in their profits!
The decline of Bitcoin in January 2026 confirmed this thought!
What to expect in 2026? 🤔
If we draw an analogy with previous periods, we can expect a decline in Bitcoin in 2026 of about 70–80% from the high of $126,000. This corresponds to a range of $25,000-$37,000.
I was surprised by such low purchase figures, as the weekly MA200-250-350 are somewhat higher and historically they often act as reversal supports.
Therefore, from a technical analysis perspective, good long-term purchases may occur after a retest and price reversal from the weekly MA200-350 in the range of $55,000-$43,000.
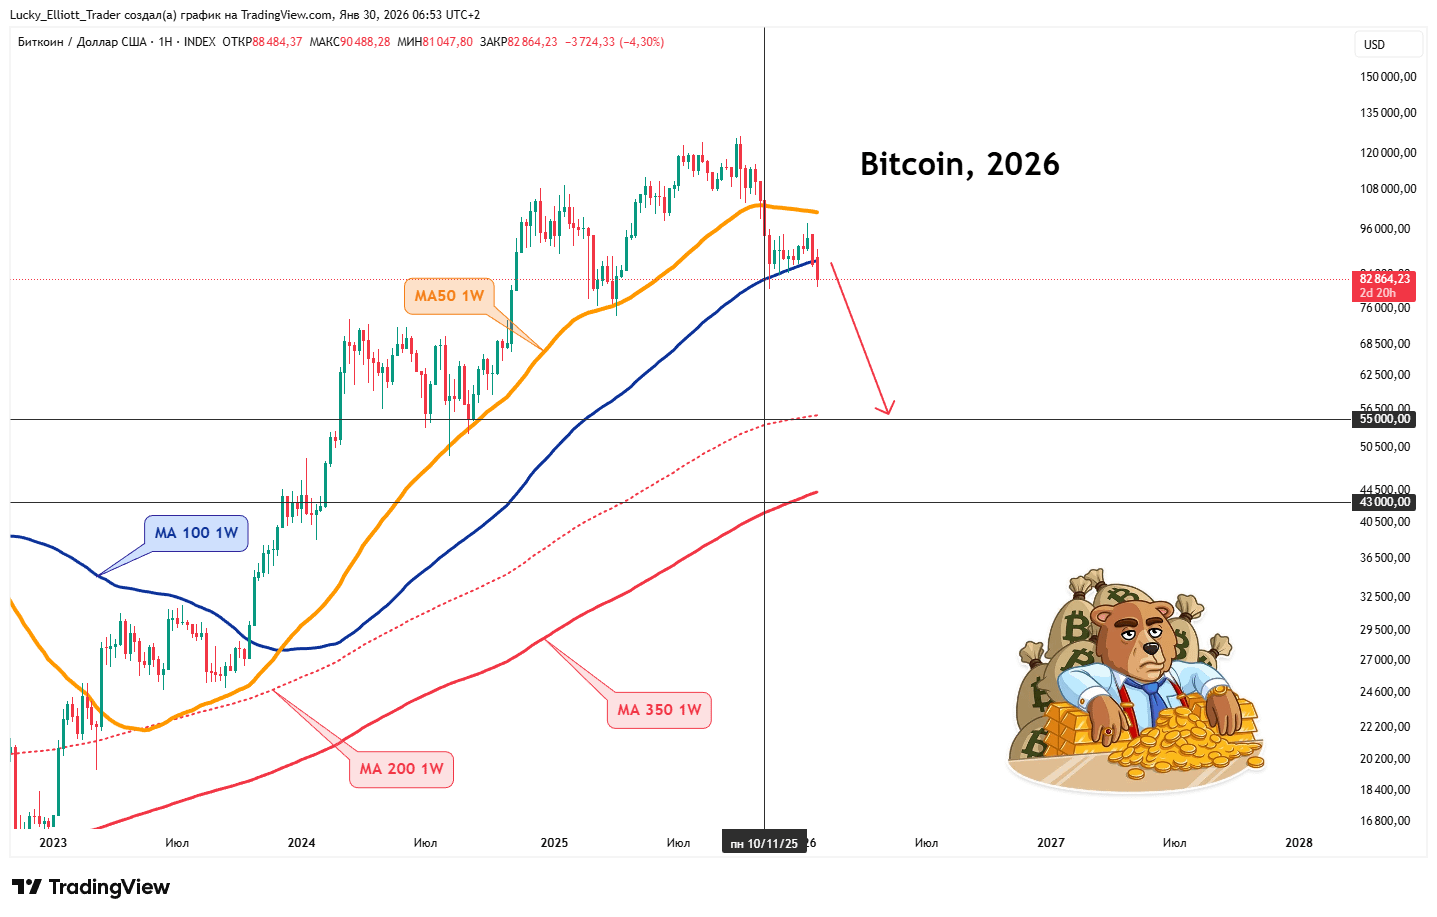
📉 Accordingly, the plan for this year is to continue shorting the decline of Bitcoin to the weekly MA200. Next, look for various signs of reversal using other analysis methods.
Wishing everyone successful trades in 2026!
