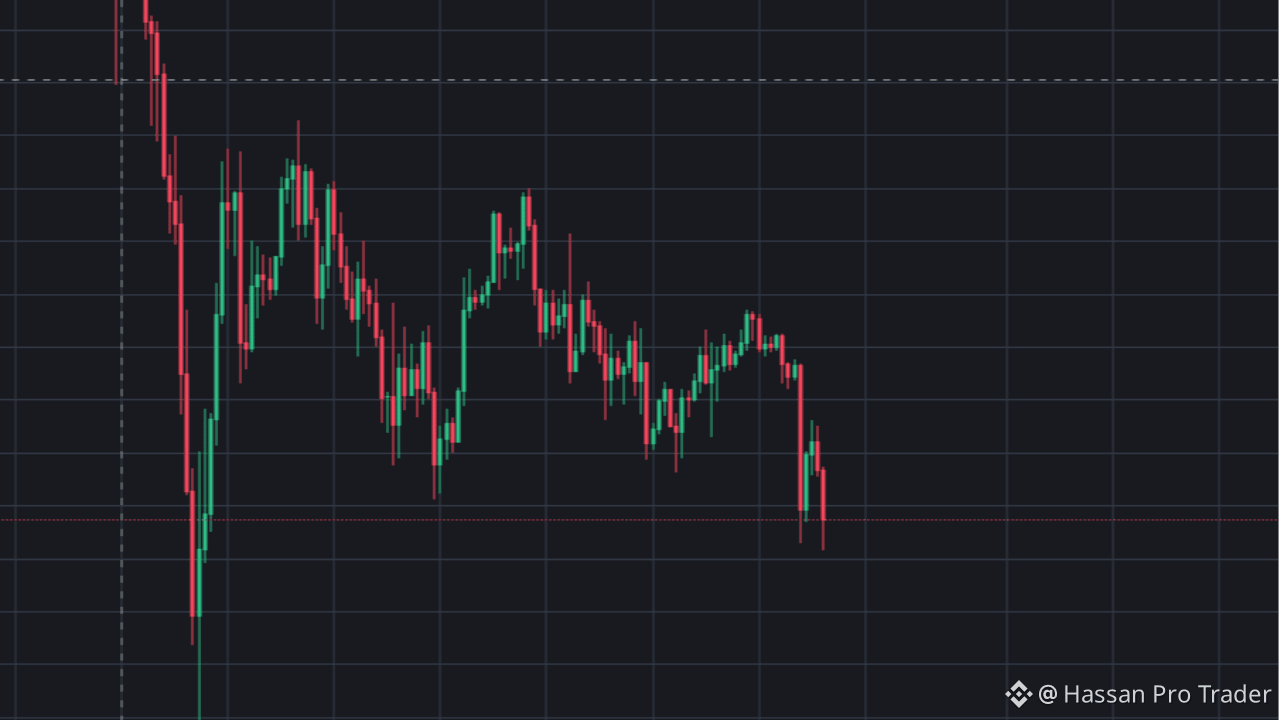
On the 4-hour chart, Bitcoin is clearly forming a double top (M pattern) that is taking shape near the resistance zone.
🔹 The price has tested the resistance twice but has not been able to break above.
🔹 The second rejection indicates that bullish momentum is weakening.
🔹 Sellers are now gaining control on the 4H structure.
📌 The key level is the neckline support.
If the price breaks and closes below this level, a strong move downwards may occur.
📉 In the case of a confirmed breakdown, the price could move towards the next lower support zones.
This setup indicates a shift from bullish to bearish structure on the 4-hour time frame.
⚠️ Wait for confirmation before any trade and definitely apply risk management.
This analysis is shared for educational purposes only.