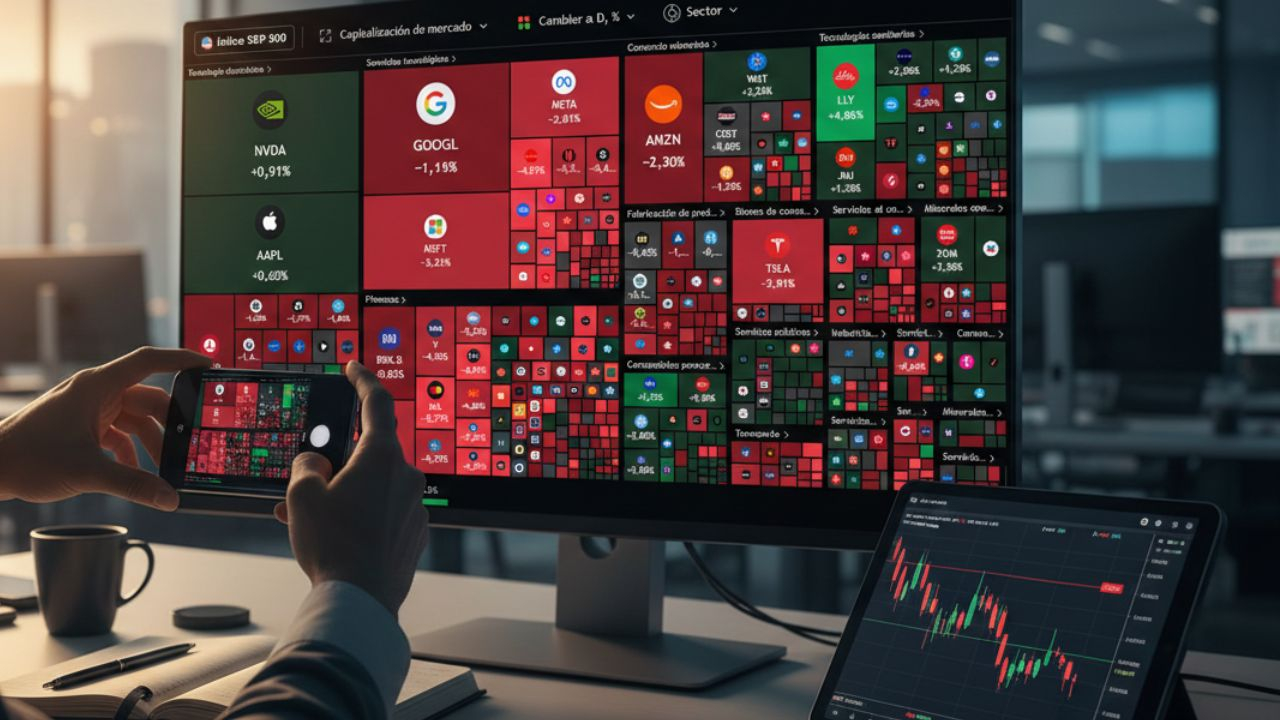
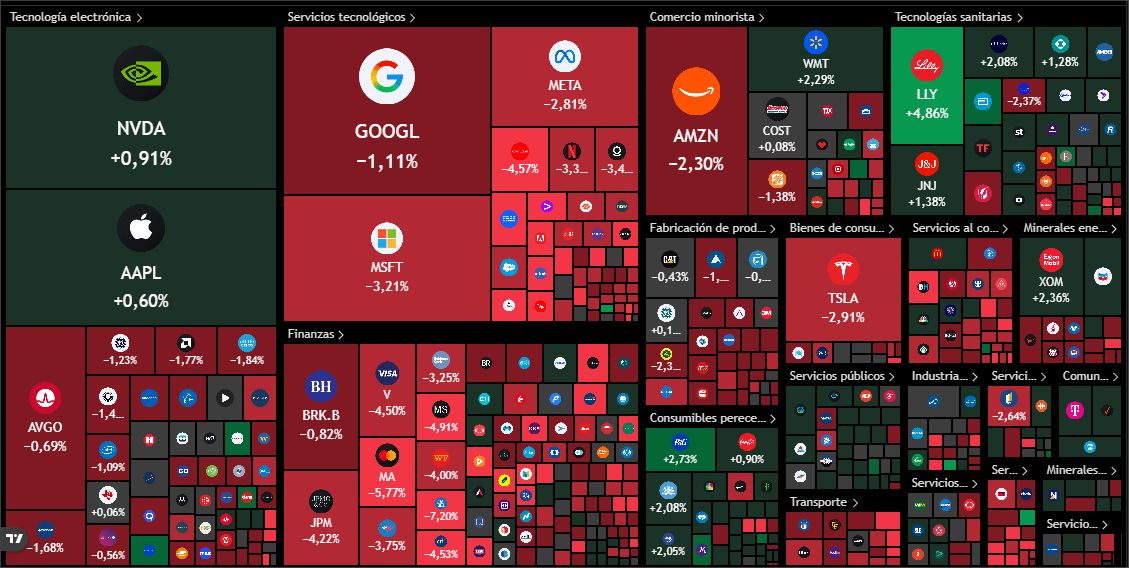
Today's heat map, February 24, 2026, looks like a thriller movie. If you opened your portfolio and saw giants like Microsoft (-3.21%) or JPMorgan (-4.22%) in deep red, don't panic: you are witnessing a real-time market lesson.
What's happening?
The market is digesting three simultaneous blows:
The 'Tariff Effect': The recent announcement of 15% global tariffs has hit the financial and tech sectors.
Interest Rates: The 10-year bond remains high (4.05%), prompting investors to pull money from growth stocks in search of safety.
The Smart Rotation: While tech stocks suffer, money moves to safety. Look at the green of Walmart (+2.29%) and Eli Lilly (+4.86%). The market is not dying, it’s moving.
Long-Term Savings and Investment Strategy: "The Modernized 60/40 Shield"
If your goal is not to trade today, but to retire peacefully, ignore the daily noise and apply this proven strategy:
Automation with DCA (Dollar Cost Averaging): Don’t try to guess the market bottom. Set up a monthly automatic purchase in a low-cost S&P 500 ETF (like VOO or IVV).
The Defensive Rebalancing: Given the context of 2026, make sure your portfolio is not 100% technology. Keep 20% in value sectors (Health, Energy, and Consumer Staples) that act as a buffer when "Big Tech" corrects.
The Golden Rule: Historically, the S&P 500 has outperformed all crises, wars, and policy changes. Time in the market always beats trying to time the market.
⚠️ Important: The information shared is not a buy or sell recommendation. Do your research (DYOR) before making any decisions.
👇 Tell me in the comments:
Are you one of those who takes advantage of "sales" when the map is red or do you prefer to wait until everything is green to buy? I read you and respond to questions!