
Bitcoin (BTC) is facing a sensitive phase as the price approaches two important technical zones: 82,000 USD above and 60,000 USD below. Market structure data combined with gamma exposure analysis from the options market suggests that these could be decisive points for BTC's next trend in the short and medium term.
82,000 USD – the 'gateway' to a new upward trend
The area of 82,000 USD is currently seen as the first dense resistance range above the current price. This is a region that has historically concentrated a large supply, where the price has been rejected multiple times. As BTC approaches this threshold, the market often witnesses profit-taking pressure and increased selling activity.
If BTC cannot hold above 82,000 USD, it is highly likely that prices will return to a sideways state or undergo a short-term correction. In the context of lacking clear macro momentum, 'false breakouts' could cause investors to be trapped.
Conversely, if BTC surpasses 82,000 USD and turns this area into support, it indicates that the supply at this level has been absorbed. At that point, the probability of continuing the upward trend towards higher liquidity zones like 85,000–90,000 USD will increase.
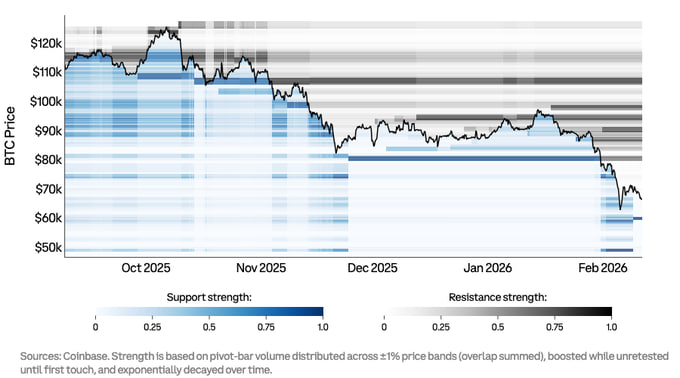 Important support and resistance levels of BTC
60,000 USD – the critical support zone
On the opposite side, 60,000 USD is seen as the densest support cluster in the current structure. This is a demand zone that has absorbed selling pressure multiple times, acting as a 'shelf' for prices.
If BTC corrects to 60,000 USD and holds this area, the likelihood of a significant bounce back is relatively high. However, the path to the support zone may experience strong fluctuations due to the influence of the options market.
If the 60,000 USD level is broken and cannot be quickly regained, the market may enter a new risk mode, with the downward trend accelerating faster than many bottom-fishing investors expect.
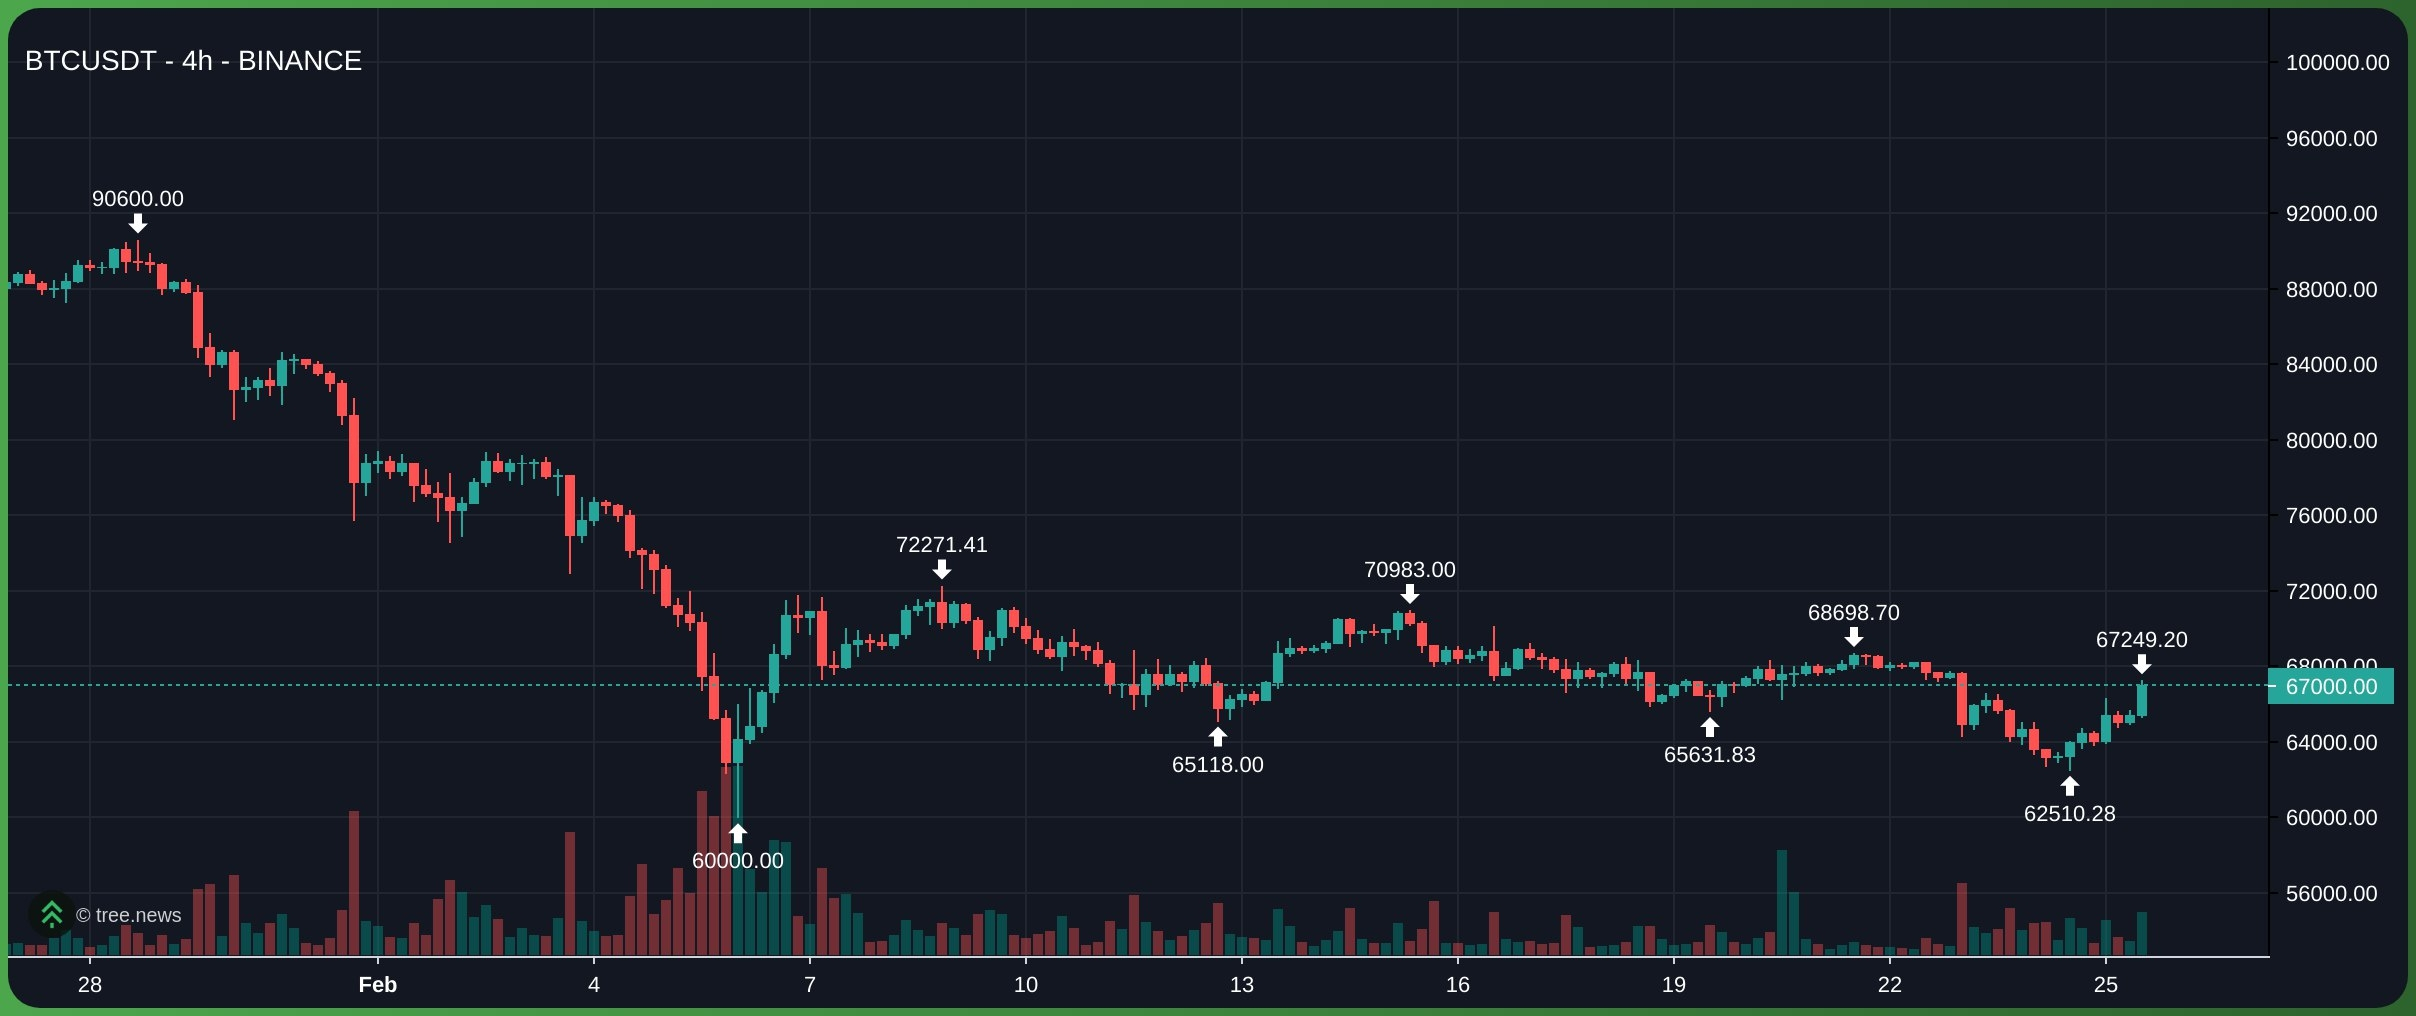 Bitcoin chart on the 4H timeframe
The role of gamma exposure in BTC price volatility
An important factor shaping the short-term structure of BTC is gamma exposure (GEX) from the options market.
Gamma exposure reflects how options market makers must hedge when BTC prices fluctuate. Depending on the status of positive or negative gamma, the hedging behavior can either dampen or amplify price volatility.
High positive gamma often stabilizes the market. When prices rise, dealers sell to hedge; when prices fall, they buy. This reduces volatility and increases the likelihood of sideways movement around important price levels.
High negative gamma, on the other hand, amplifies trends. When prices rise, hedgers must buy more; when prices fall, they must sell more. This loop can cause volatility to become stronger and faster.
Currently, data shows that the 60,000–70,000 USD range is concentrated with significant negative gamma. This implies that if BTC drops to 60,000 USD, selling pressure may accelerate before the market finds a balance.
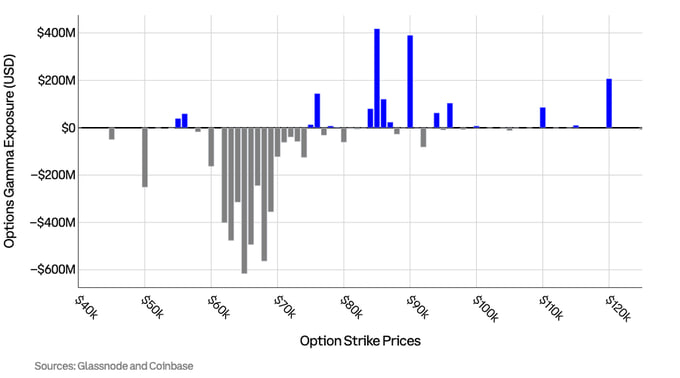 Gamma exposure level of BTC options (GEX)
Meanwhile, above 85,000–90,000 USD, there are positive gamma clusters. This could slow down any upward momentum, if it occurs, causing it to 'anchor' around these price levels rather than break out strongly immediately.
Possible scenarios
Scenario 1: BTC is rejected at 82,000 USD
If BTC approaches 82,000 USD but cannot hold above this level, the likelihood of regression to the mean will be higher. In that context, the market may return to the accumulation zone or adjust down to lower levels.
Scenario 2: BTC exceeds 82,000 USD and maintains above this level
Acceptance of prices above 82,000 USD would be a positive technical signal, indicating that buyers are in control. However, due to the presence of positive gamma above, the upward movement may occur in a 'slow climb' rather than an immediate explosion.
Scenario 3: BTC drops to 60,000 USD and bounces back
If BTC touches 60,000 USD and quickly regains this level, this could signal that support is still intact. However, due to the influence of negative gamma, the prior drop could occur sharply and create short-term panic.
Scenario 4: BTC loses 60,000 USD
In the event that 60,000 USD is broken and cannot recover, the downward trend may extend faster than expected. This is particularly noteworthy when combined with the structure of negative gamma, which tends to amplify volatility.
Conclusion
Bitcoin is at a crucial juncture as it approaches two key price zones of 82,000 USD and 60,000 USD. The combination of supply-demand structure and gamma exposure suggests that the market may enter a period of strong volatility if either of these levels is broken.