Date: February 27, 2026
Author: fabianocsaraujo1925
Highlighted Assets: $BTC | $ETH | $SOL
Trader Profile (Simulated): ROI 15.2% in the last 30 days | Positions: Long in BTC (entry: $64,200) | Hedge in gold ($PAXG)
📈 1. Overview: The Fall That Doesn't End, But May Be Losing Strength
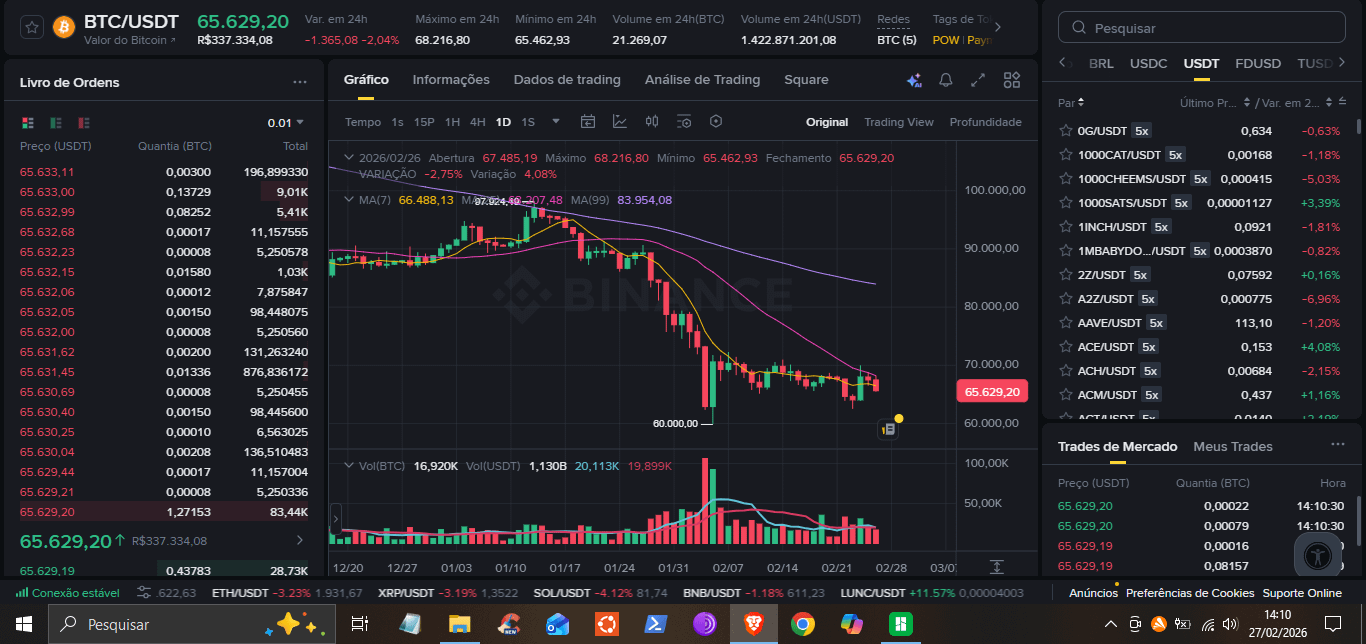
Bitcoin woke up another day in the red, retreating to the range of $67,000 and heading for the fifth consecutive month of declines – the worst streak since 2022. The accumulated drop in February has already exceeded 14%, and the asset has plummeted about 50% since the all-time high of October ($126,000).
But behind this pessimistic scenario, one of the most respected analysts in the industry has raised a yellow flag. Willy Woo made a statement that deserves attention: the selling pressure from investors seems to have exhausted.
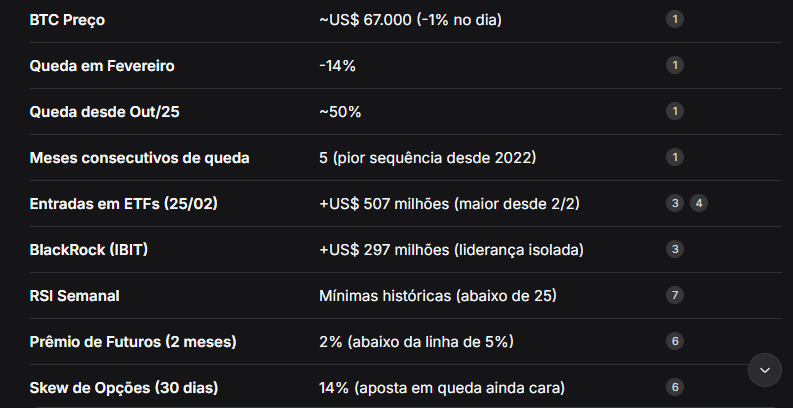
Infographic: The Market in Numbers (02/27)
📉 2. Deep Analysis: What Willy Woo (and Other Analysts) Are Seeing
2.1. Woo's Thesis: Exhaustion, Not Euphoria
In a post on X, Woo stated that "the bearish selling by investors seems to have exhausted." This means that the pressure that has been pushing the price down may finally be losing strength.
But it’s not a reason to celebrate (yet). According to him, this exhaustion gives the price "a relief to consolidate sideways for perhaps a month" – or, in the more optimistic scenario, a bounce to the $75,000 range, which "would likely be rejected."
Woo's "informed guess" is that the fourth quarter of 2026 will be the true end of the bear trend, with bullish momentum returning only in the first or second quarter of 2027.
The most important alert: Woo reminds that Bitcoin has only existed within a "structurally bullish global macro market" since 2009. If "the global macro breaks," the pullback support would be $30,000, and the final level to maintain the long-term bullish trend would be $16,000.
2.2. The Market's Counterpoint: Divergence Between Price and Positioning
Derivatives data tells a complex story. The premium on 2-month futures is only 2% – well below the 5% line that separates a neutral market from a bullish one. The 30-day options skew remains at 14%, indicating that traders are still paying more to protect against declines than to bet on increases.
Translating: professionals have not yet bought into the recovery thesis.
2.3. ETFs: The Data that Contradicts Pessimism
On February 25, Bitcoin spot ETFs recorded $507 million in net inflows – the highest amount since February 2. BlackRock led with $297 million, followed by Fidelity ($83 million) and ARK ($71 million).
This is relevant for two reasons:
It broke a sequence of 5 weeks of outflows totaling $3.8 billion
Shows that institutional money is coming back, albeit timidly
2.4. The RSI that Screams "Caution"
Bitcoin's weekly RSI has dropped to levels never seen before, below 25. Historically, such extreme readings precede reversals – but not without causing a "bear trap," where the market attracts sellers before turning.
Analysts point out that there is a buildup of short liquidity 7x greater in the $70,000 range, which creates the perfect scenario for a short squeeze if the price can break through.
🧠 3. Educational Guide: Understanding "Selling Exhaustion" and the "Bear Trap"
3.1. What is selling exhaustion?
When the price falls for an extended period, weaker sellers (retail, leveraged traders) are forced to exit the market – either through liquidation or resignation. At some point, only long-term holders remain, who do not sell. Selling pressure dries up. That’s when the price can, technically, start to find a floor.
3.2. What is a "Bear Trap"?
It is a price movement that makes traders believe that the downward trend will continue, leading them to open short positions. When the price suddenly reverses, these shorts are liquidated, forcing buybacks and accelerating the rally. The RSI at historical lows combined with high short liquidity is the classic recipe for a bear trap.
Trade Setup: Strategy for BTC (02/27)
Woo's Scenario (Consolidation): Expect sideways movement between $60,000 and $70,000 for weeks. Strategy: range trading, buying near the bottom, selling near the top.
Optimistic Scenario (Bounce): If BTC breaks $70,000 with volume, it can target $75,000, but the expectation is for rejection.
Pessimistic Scenario (Macro Break): If the global scenario worsens, prepare to test $30,000 (pullback support) or even $16,000 (final line).
💬 4. Engagement and Social Proof
Woo's message echoes what Matt Hougan from Bitwise also said: "a lot of people who were long have already sold. The pressure is ending. We will form a bottom and, in the future, establish new highs."
Jeff Ko from CoinEx adds: "a V-shaped recovery is unlikely after a 50% drop. We will probably have months of consolidation, just like after the LUNA collapse."
Now I want to know from you: Do you believe in Woo's thesis of consolidation until the end of the year, or do you think the macro will break before that? Are you long, short, or just observing? Comment below!