Markets were shaken today by one of the fastest and steepest declines in precious metals history.
According to market data and viral trading charts:
Gold and silver lost $1.1 trillion in just 60 minutes.
SILVER: 7% DROP — LOSS OF $370 BILLION
Silver was even more affected. The silver CFD chart shows:
A steep vertical drop over the course of an hour
A clear pattern of price rejection after the opening.
A drop of 7%, with a value collapse of $370 billion.
Analysts are calling this "an industrial catastrophe combined with panic among investors" — affecting both retail and institutional accounts.
GOLD: 2.05% DROP — LOSS OF $750 BILLION
Gold markets opened with momentum, but in just one hour, the movement sharply reversed. As shown in the real-time hourly chart:
Prices surged at the beginning of the session.
Then, it abruptly reversed the trend, triggering a wave of selling.
The market fell 2.05%, with an estimated loss of $750 billion in value.
Traders describe this as a liquidity vacuum — a quick exit, with no support floor.
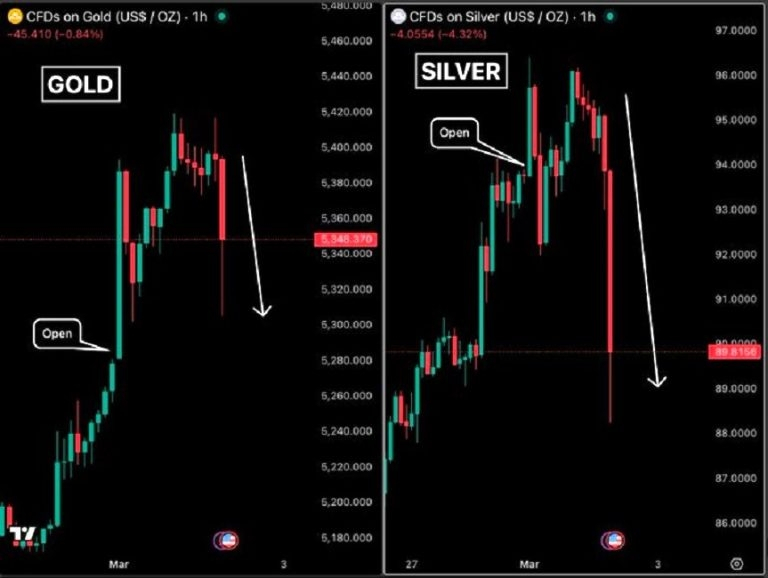
THE CHARTS TELL THE STORY
The image compares the price movements of gold and silver on the 1-hour chart:
Gold chart (left): Sharp rise → flat peak → aggressive descending candle
Silver chart (right): Gap opening → massive rejection → multiple red bars until a cliff
Both assets show accelerated outflows with no immediate recovery.
The time interval between the two events suggests a coordinated liquidation or an algorithmic domino effect.