Hello, Binancians! The market is giving us interesting movements today and ZORA/USDT is the absolute protagonist. If you are looking for volatility and price action, check this out.
🔍 Technical Analysis (Timeframe 1m/5m)
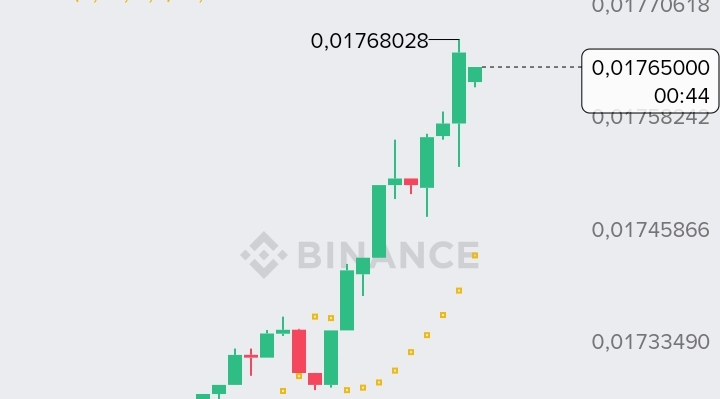
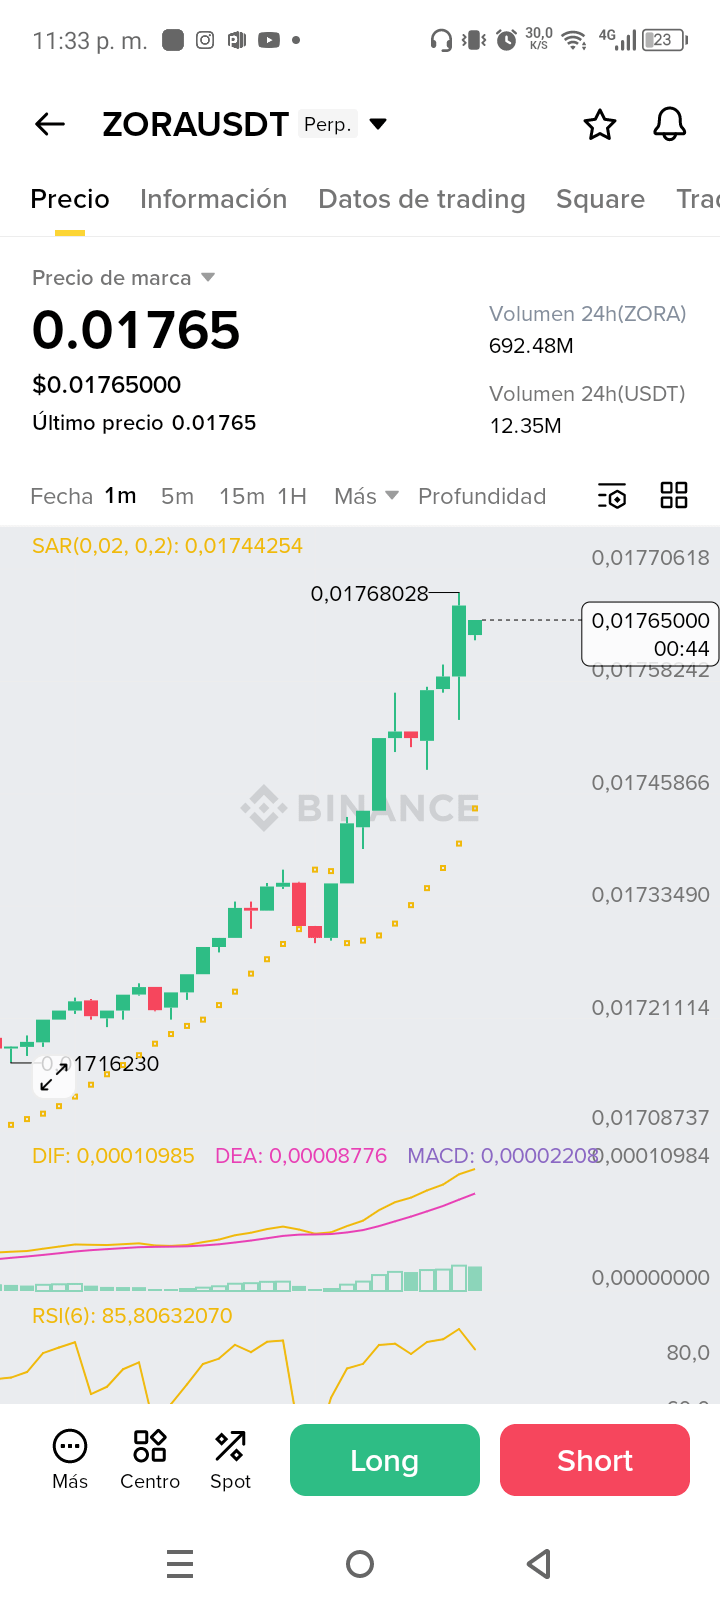
Based on recent captures, this is what the chart is telling us:
Explosive Trend: The asset has broken local resistances with large green candles. The Parabolic SAR (the yellow dots) remains firmly below the price, confirming a solid bullish trend in the short term.
RSI Alert: Attention here! On the 5-minute chart, the RSI(6) is touching extreme levels of 98.52.
Note: An RSI above 80 usually indicates that the asset is "overbought". This does not mean it will stop rising immediately, but the risk of a technical correction (a "pullback") is high.
Healthy MACD: The MACD lines continue to expand upwards, showing that the momentum is still on the side of buyers for now.
💡 My Strategy for ZORA
In these types of "parabolic" scenarios, the key is not to enter out of FOMO (fear of missing out), but to manage the risk:
Pullback Entries: Do not chase the green candle. Wait for the price to test the SAR points or the nearest moving average before considering a Long.
Gradual Take Profit: With such a high RSI, it's vital to take partial profits.
Adjusted Stop Loss: Volatility in ZORA is high; protect your capital.
🔥 Trade with me
Are you struggling to identify these entry and exit points in real-time? Don't trade alone in this wild market.
Are you struggling to identify these entry and exit points in real-time? Don't trade alone in this wild market.
✅ Follow me for more signals and live analysis. ✅ Copy my trades: If you want to benefit from my risk management and technical analysis, look for my profile in the Copy Trading section of Binance.
Let's go for those greens! 💰✨
#ZORA #TradingSignals #TechnicalAnalysis #Binance #Crypto
