To start trading, understanding the language of the market is the most important, which we call Price Action. 🗣️📊 The purpose of technical analysis is to estimate future price movement by looking at past data and charts. It's just like guessing the next scene after watching an old movie! 🎬🔮 [1, 2]
🕯️ What Are Candlestick Charts? 📊
Compared to line charts 📉, candlestick charts 🕯️ tell us the whole story of the market. They reveal 4 essential things in every timeframe: Open, High, Low, and Close (OHLC). 🔢🔥 [2]
🟢 Green Candle (Bullish): This means the price went up! The "Bulls" are in charge of the market and buyers are in control. 💪🚀 [2, 3]
🔴 Red Candle (Bearish): This means the price went down! The "Bears" are dominating the market and sellers have put in a lot of effort. 📉🐻 [2, 3]
🥢 Wicks/Shadows: The stick above and below the candle indicates how volatile the market was at that time and how far the price touched before coming back. 🎢💨 [1, 4]
🚀 3 Powerful Candlestick Patterns (Everyone Should Know!) 🔥
If you are new to trading, sip on these 3 patterns:
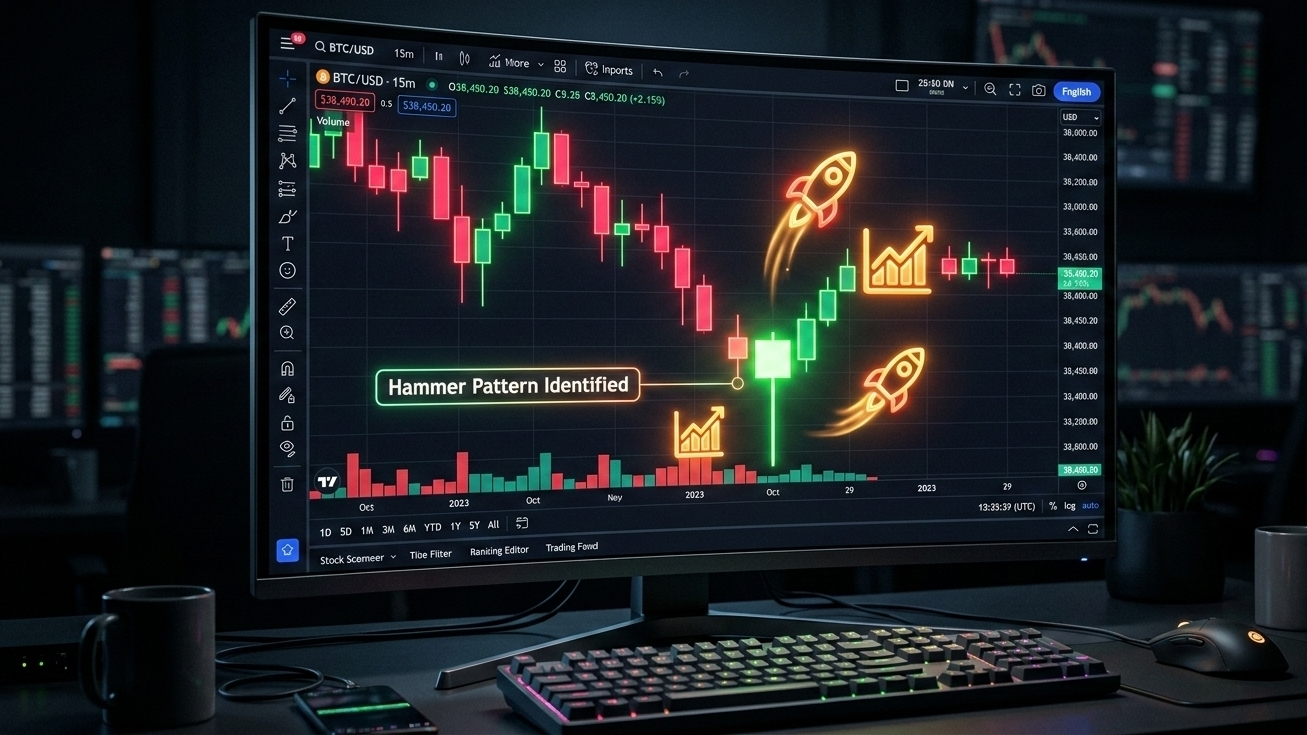
🔨 Hammer: This is a powerful reversal signal that often forms after a declining (downtrend) market. It means that sellers are now tired and buyers are coming back into the market! 🛒🔥 [1, 3]
⚖️ Doji: When the opening and closing price of the candle are almost the same. This indicates "Indecision" or confusion in the market. 🤷♂️🤔 It means that the trend is about to change! [1, 4]
🌊 Engulfing Pattern: When a large candle completely covers the previous small candle (meaning it eats it up!). A bullish engulfing means that an uptrend is about to begin! 📈🔥 [1, 3]
💡 Pro-Tip (Important Advice): 🎯
Don't jump just by seeing patterns! 🚫 Only when these patterns form at a "Support" (floor) or "Resistance" (ceiling) level do their true power become evident and the chances of profit increase. ✅💰 [1, 5]
#TradingCommunity #technicalanalyst #USJobsData #Binance #TradingStrategies💼💰