1. Technical analysis from the chart
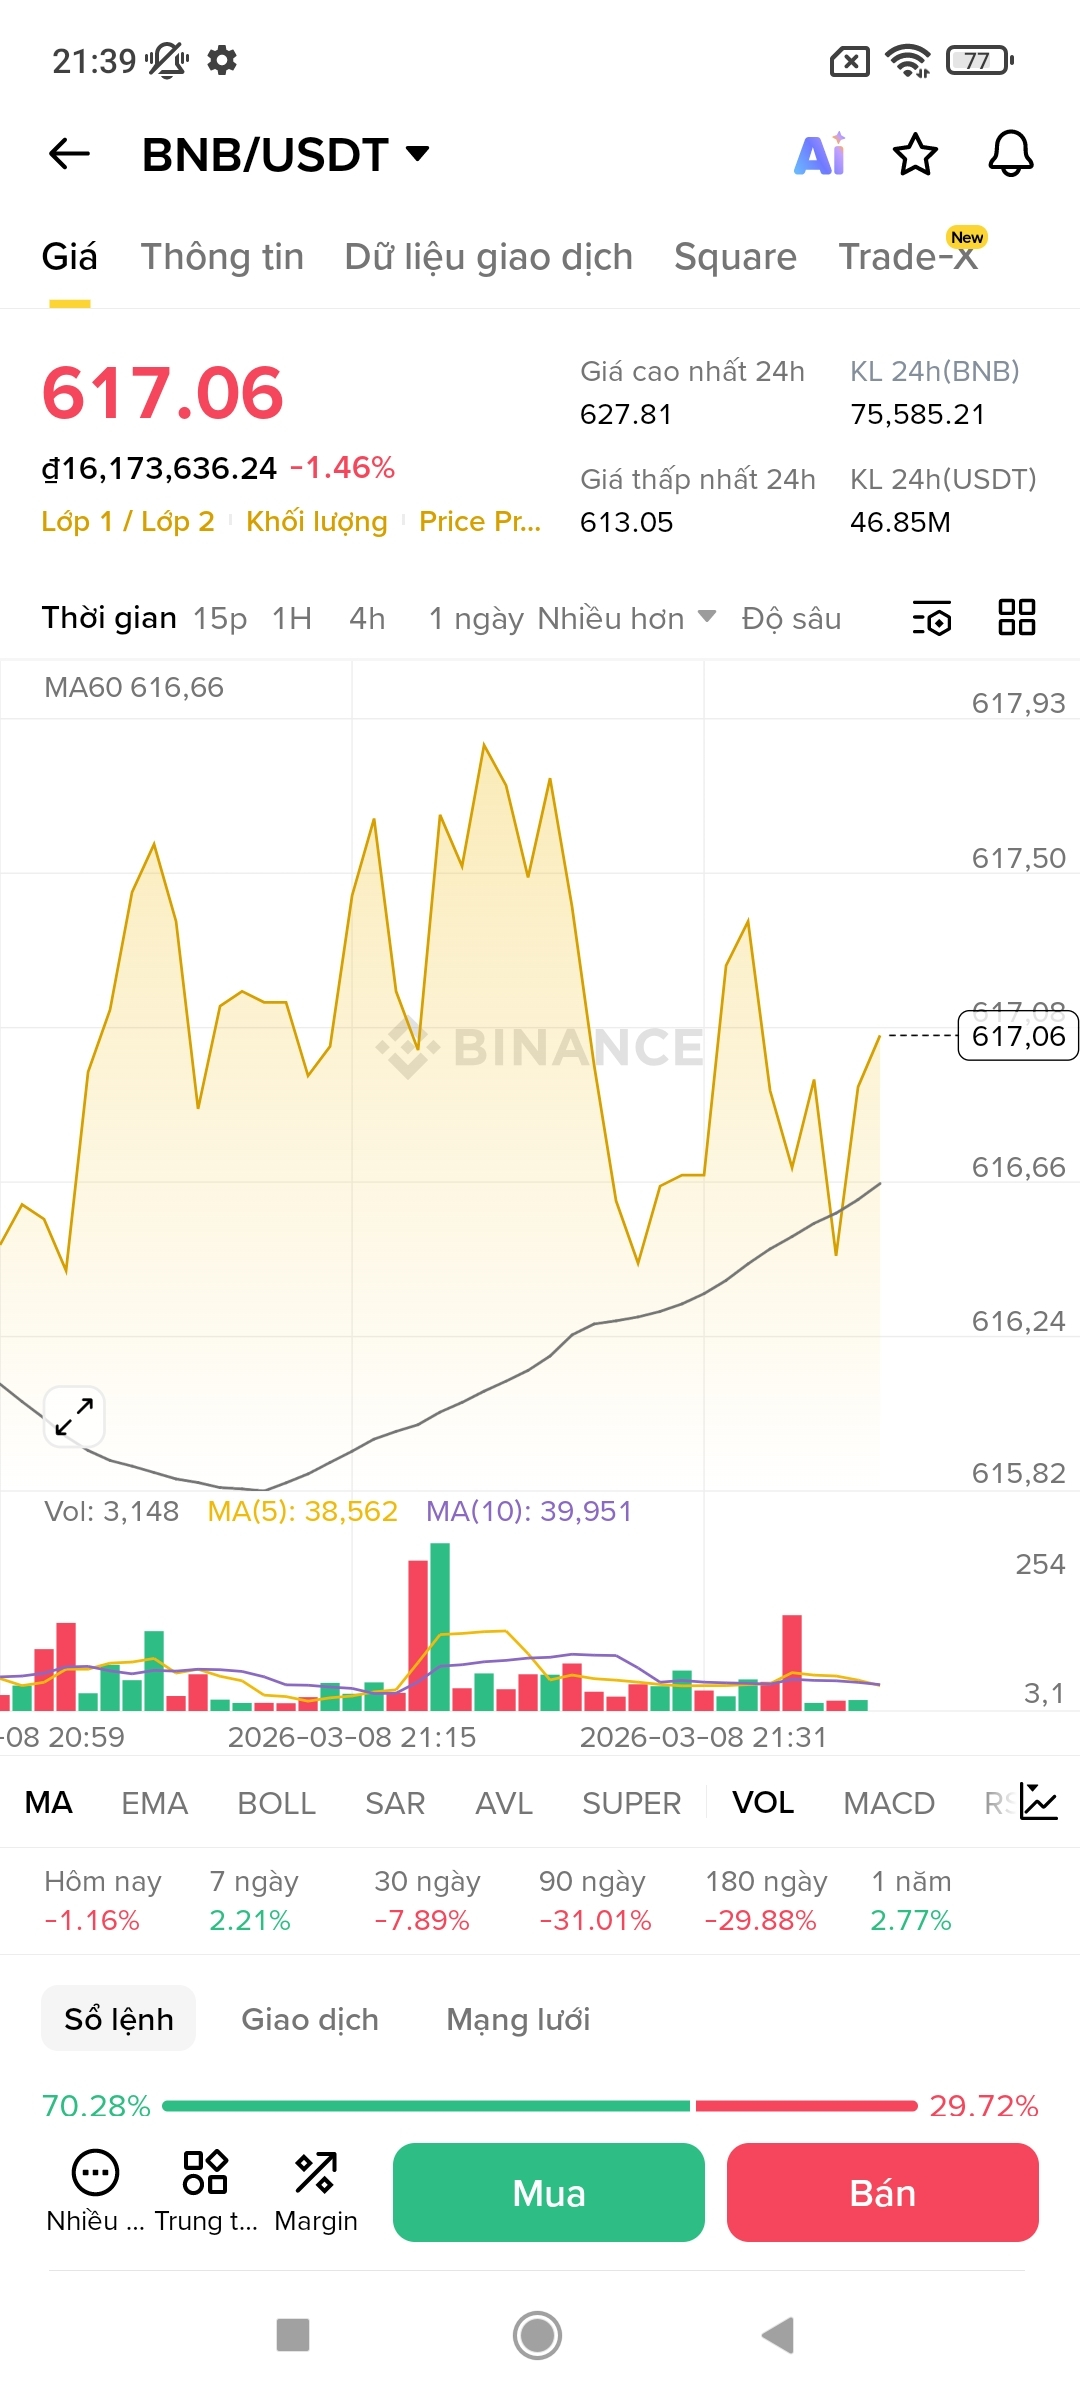
Current price: 617.06 USDT, slightly down (-1.46%) compared to the previous session.
Short-term trend: The price is above the MA60 line (around 616.66). Maintaining above the MA60 level is a positive signal indicating that buyers are still trying to defend their position.
Volatility: The line chart shows very sharp "sawtooth" patterns. The price continuously hits short-term peaks around 617.93 and is then pushed down again, indicating that selling pressure at the upper region is still quite thick.
Market sentiment (Order Book): The buy ratio (70.28%) is completely overwhelming compared to the sell ratio (29.72%). This is often a sign that the buying power is very strong.
2. "Opportunity" or "Surprise"?
Opportunity scenario: If the price stabilizes above the 617 mark and surpasses the psychological resistance level of 620, this could be a pause before a new growth phase (retesting the 24h peak at 627.81).
Surprise scenario (Risk): Looking at the historical data below, the price has dropped more than 31% over the past 90 days. This indicates that the medium-term trend has not really escaped the pressure of adjustment. If it breaks the 613 mark (24h low), a short-term sell-off may occur.
3. Reactions of the "customers" (Investors)
This variable often divides investors into two groups:
Optimistic group (Bulls): Looking at the buy ratio of 70%, they see this as a "discount" price range to accumulate more before the market recovers.
Cautious group (Bears): They will wait for clearer confirmation. With a decrease of 7.89% in the past 30 days, this group may be concerned that this is just a technical rebound (bull trap) before probing for a new low.
Advice: The crypto market is always full of surprises. With the current volatility, closely observing the trading volume in the next few hours is very important to determine whether the 70% buying power is enough to push the price to break through.