

Sui has experienced a difficult stretch in recent months, with price action and on-chain metrics reflecting a sharp cooldown after its earlier hype cycle. While the Layer-1 blockchain was once widely compared to Solana during its explosive 2021 bull run, the reality so far has been far more challenging.
As of now, SUI trades around $0.89, representing a 45% decline over the past 90 days and roughly 83% below its all-time high. The token currently holds a market capitalization of approximately $3.47 billion, placing it among the larger Layer-1 blockchain projects despite the recent downturn.
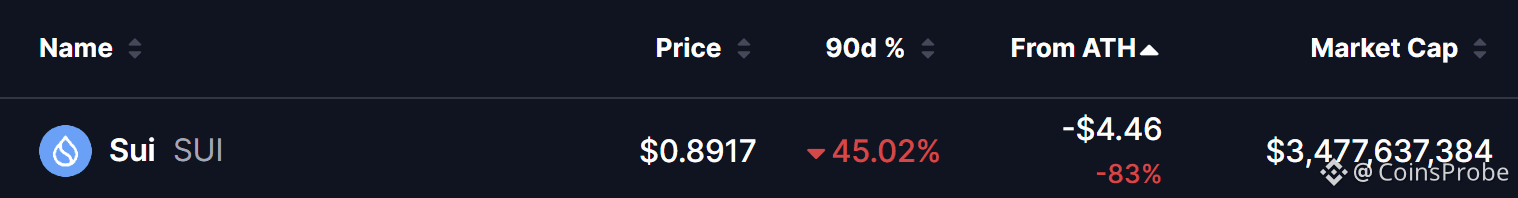 Source: Coinmarketcap
While the ecosystem continues to develop, both price performance and DeFi liquidity trends suggest that Sui has yet to replicate the explosive growth that Solana experienced during its peak cycle.
Sui’s DeFi Liquidity Sees Major Decline
A major indicator of weakening momentum has been the sharp drop in Total Value Locked (TVL) across the Sui ecosystem.
According to data from DefiLlama, Sui’s TVL peaked around $2.63 billion in October 2025. However, that figure has since fallen dramatically to approximately $566 million as of March 2026.
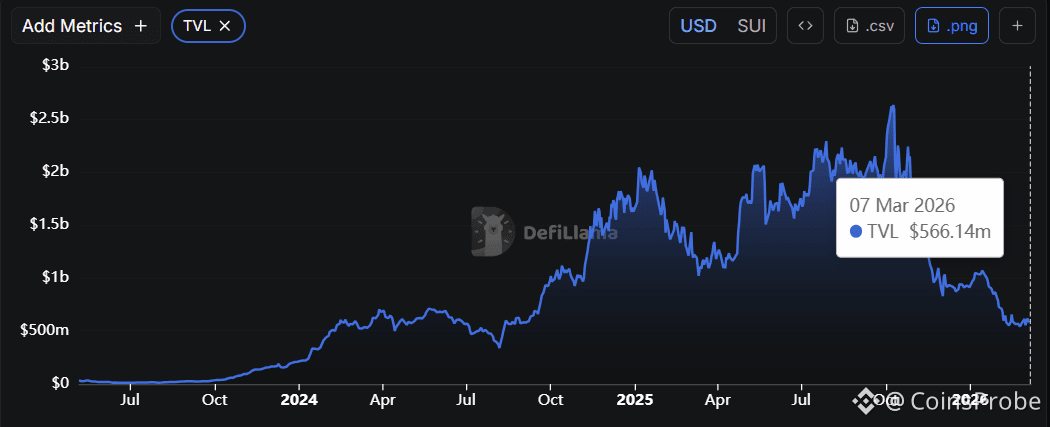 Source: DefiLlama
This represents a drop of nearly 80% in locked capital, highlighting reduced activity across decentralized applications built on the network.
A declining TVL often signals:
Lower DeFi participation
Reduced liquidity across protocols
Declining user activity
For investors tracking Layer-1 ecosystems, TVL remains one of the most important metrics for assessing network health and developer traction.
BNB Fractal Suggests a Familiar Market Cycle
Despite the bearish conditions, an interesting technical pattern has caught the attention while comparing Sui’s market structure to the historic cycle of BNB.
Back in March 2020, BNB experienced a massive 76% correction before eventually reclaiming its 100-day moving average. Once momentum returned, the token rallied more than 850%, ultimately topping near the 2.618 Fibonacci extension level before entering another brutal correction of roughly 84%.
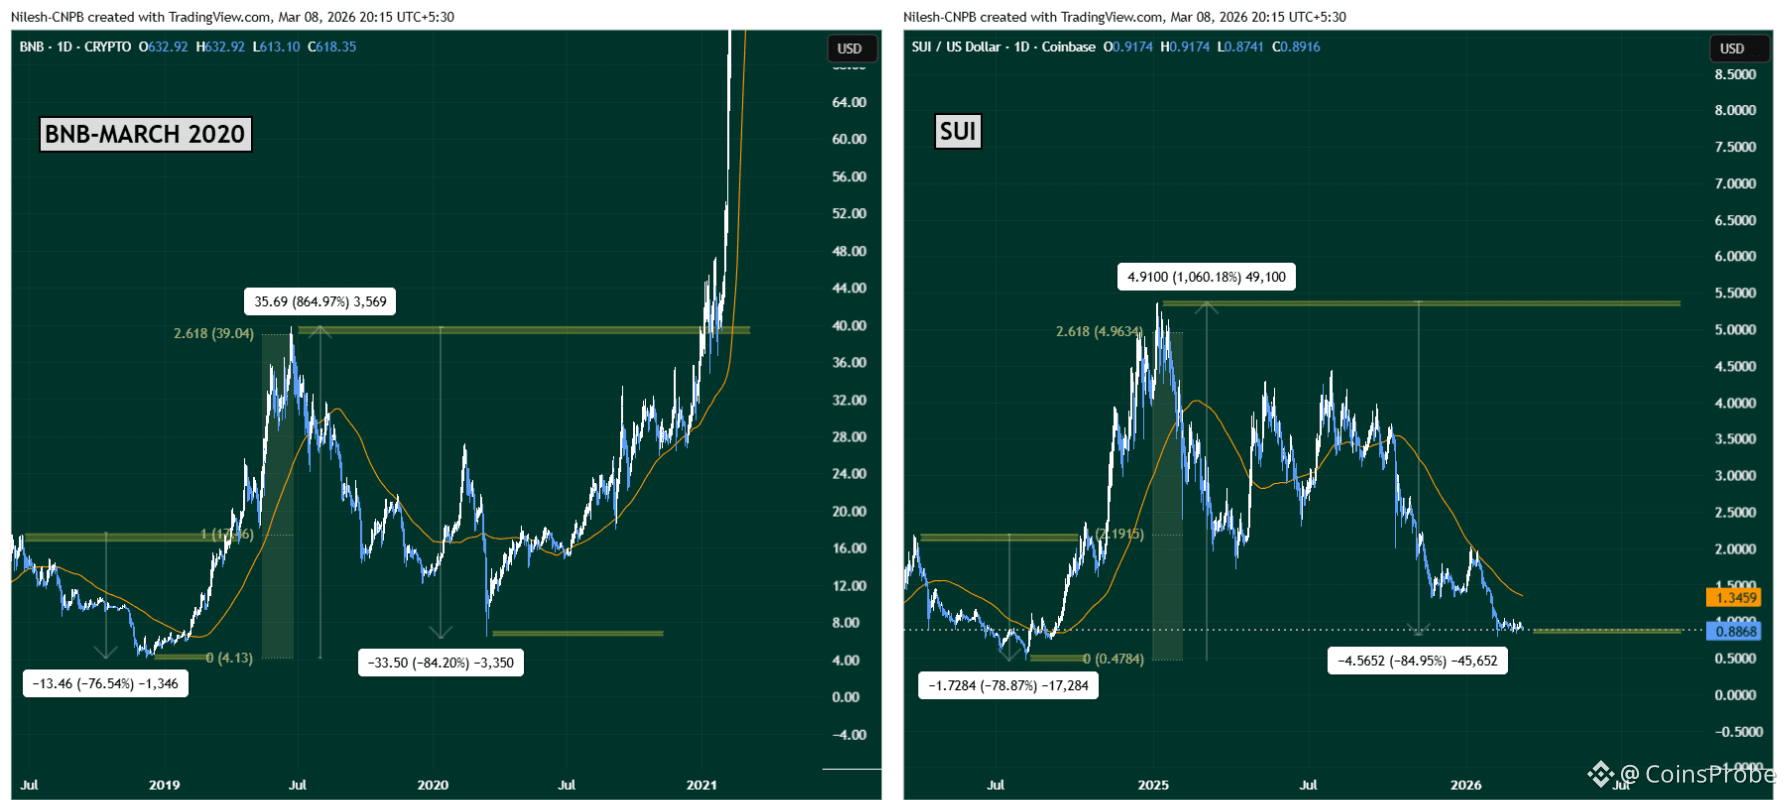 BNB and SUI Fractal Chart/Coinsprobe (Source: Tradingview)
Interestingly, Sui appears to be following a strikingly similar path.
The chart comparison shows that:
SUI first suffered a 78% correction during its early cycle
It then staged a massive rally exceeding 800%
The rally also topped near the 2.618 Fibonacci extension level
The token is now experiencing a brutal 84% correction
This structure closely mirrors the same sequence that occurred in BNB’s 2020 market cycle—a pattern that ultimately preceded a powerful bullish reversal.
What’s Next for SUI?
If the fractal comparison with BNB continues to hold, the current price region near $0.80–$0.90 could potentially represent a long-term accumulation zone.
Historically, deep corrections following extended rallies often serve as reset phases before the next major market expansion.
However, confirmation of a bullish reversal will require a key technical milestone.
For $SUI watching the 100-day moving average near $1.3459 will be crucial. A decisive reclaim of this level would signal renewed momentum and potentially mark the beginning of the next upward trend.
Until then, the market may remain in a consolidation phase, as investors assess whether Sui can rebuild ecosystem growth and eventually reignite the excitement that once drew comparisons to Solana’s legendary 2021 run.
Disclaimer: The views and analysis presented in this article are for informational purposes only and reflect the author’s perspective, not financial advice. Technical patterns and indicators discussed are subject to market volatility and may or may not yield the anticipated results. Investors are advised to exercise caution, conduct independent research, and make decisions aligned with their individual risk tolerance.