RSI – How to know when the market has "eaten" too much and is feeling sick
Have you ever wondered why, just after you buy a coin that keeps rising, the price suddenly crashes as if it saw you enter? No, it's not bad luck and the market has nothing to do with you. You simply bought when the market was "stuffed."
Today we talk about the indicator that tells you whether a price is inflated or undervalued and about to explode.
What is the RSI, in our language?
Imagine an elastic band. You can stretch it a lot, but at some point, it either breaks or snaps back and returns to its original shape. The RSI (which ranges from 0 to 100) measures exactly how stretched this elastic is:
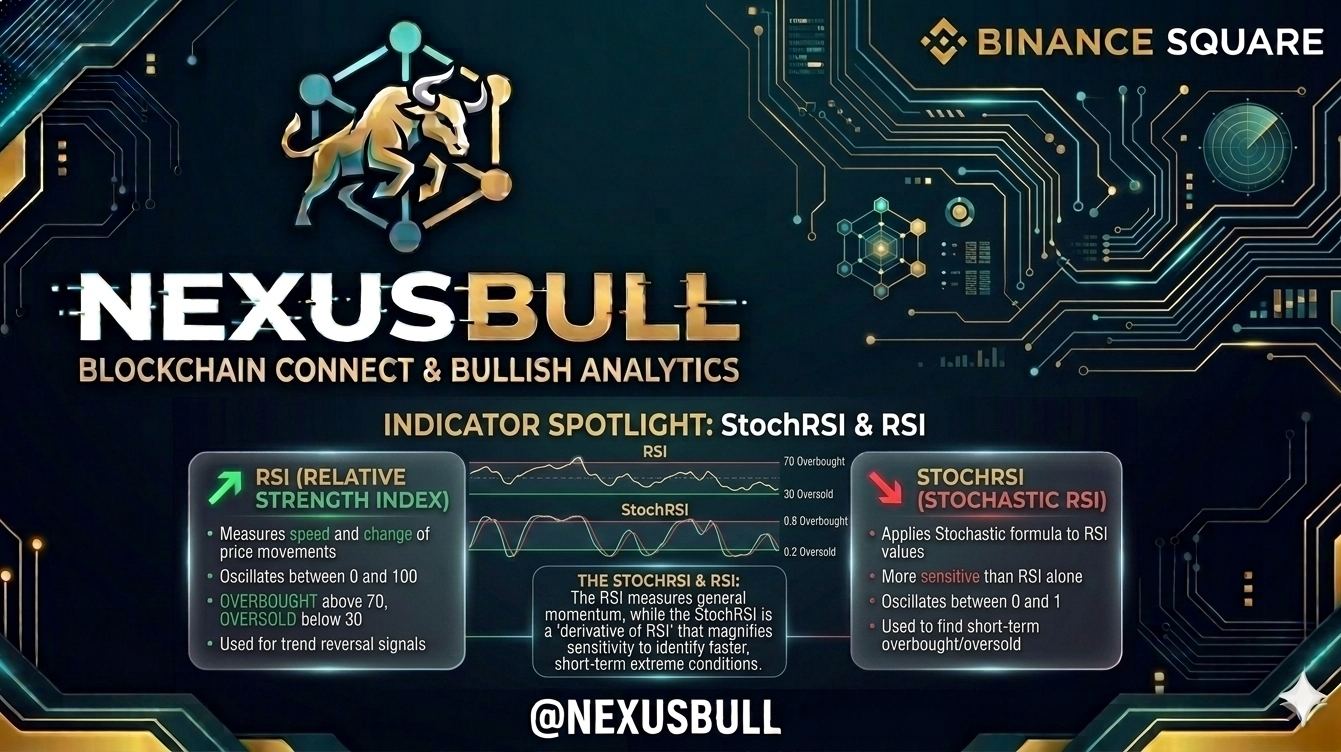
Over 70 (Overbought / Overbought): The market is ecstatic. Everyone has bought, the price is at its highest and the 'engine' is hot. It's like you've eaten three servings of dessert: you're full, you can't eat anymore, and you're likely to feel sick soon. This is the moment when we, on Spot, start thinking about taking profits, not buying.
Sub 30 (Oversold / Oversold): Total panic. Everyone has sold, the chart is at rock bottom and optimism is zero. The elastic is stretched to the maximum downwards. Here is the 'discount' zone. Here is the moment when NexusBull starts to sharpen its horns and look for entries.
The trap that all beginners fall into
The biggest mistake is to think that if the RSI reaches 70, the price will drop right at that second. No! A coin can stay 'stuffed' (over 70) for a long time if the enthusiasm is huge.
The secret is not to sell immediately, but to understand that the risk has increased enormously. It's like driving at 200 km/h: you can keep going like that for a while, but if an obstacle appears, the impact will be much more painful than at 50 km/h.
How do we use it smartly?
On Spot, we look for divergences. It sounds complicated, but it's simple:
If the price makes a new high, but the RSI 'gets tired' and makes a lower high than last time, it's a clear sign that the bulls have run out of breath. It's the final warning that the storm is coming.
My conclusion? The RSI is your detector of lies. When everyone is screaming 'Bull Market!' on green screens, but the RSI shows you that the market is already at 85-90, be careful. It's better to lose a small remaining rise than to be 'stuck' at the historical maximum.
Where do you look first: at the price or at how hot the RSI is? Do you have the courage to buy when the indicator is below 30 or are you afraid of the 'falling knife'? 👇#BinanceAcademy