The market often looks chaotic, especially on lower timeframes like the 5-minute chart. But with a few simple tools, traders can begin to understand what the market is doing.
Today we explored one of the most useful combinations for reading short-term market structure:
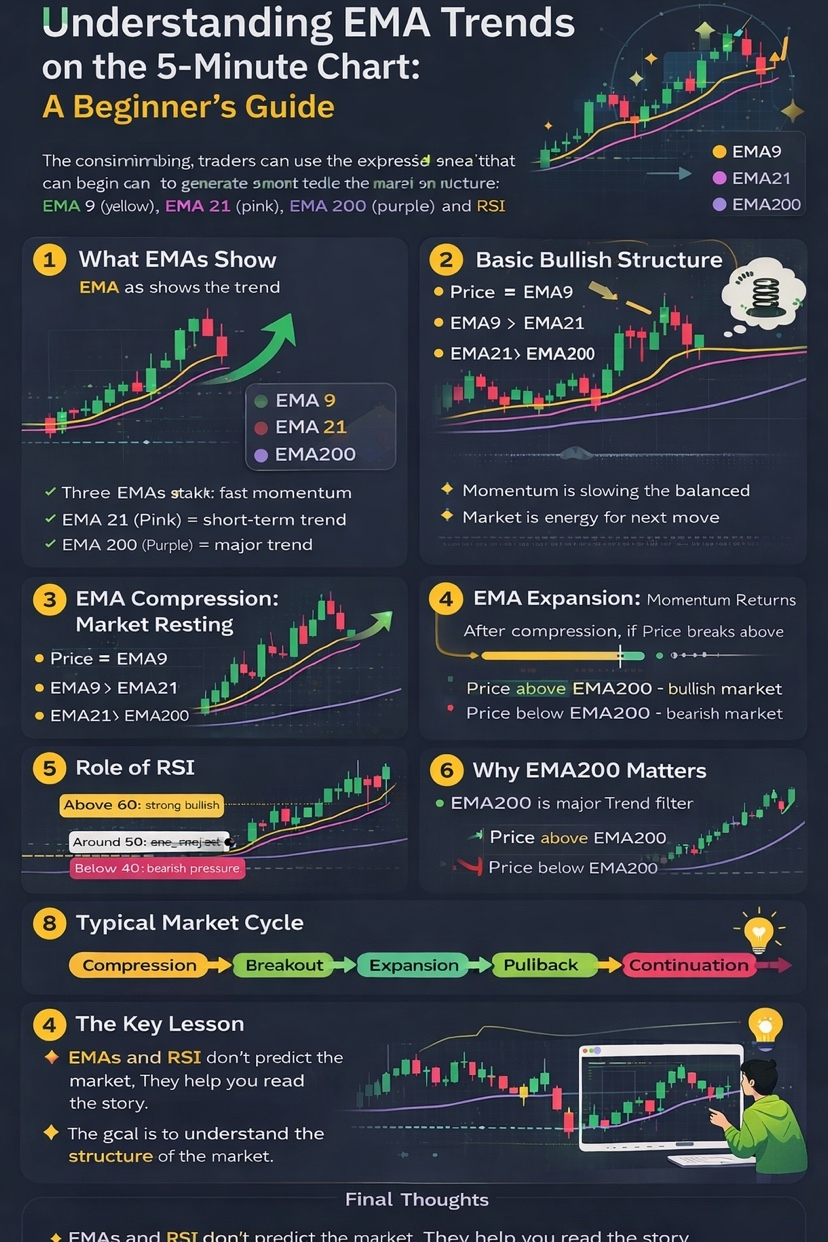
EMA 9, EMA 21, EMA 200, and RSI.
Let’s break down how these indicators help traders understand momentum, trends, and market pauses.
1. What EMAs Actually Show
EMA stands for Exponential Moving Average. It helps smooth price movements so traders can see the trend more clearly.
In our setup we used three EMAs:
EMA 9 (yellow) – shows fast momentum
EMA 21 (pink) – shows the short-term trend
EMA 200 (purple) – shows the major trend direction
These lines act like dynamic support and resistance levels.
2. The Basic Bullish Structure
A market is considered bullish when the EMAs stack in this order:
Price
EMA 9
EMA 21
EMA 200
In numbers it might look like this:
EMA21 = 100
EMA9 = 101
Price = 102
This structure shows that buyers are currently stronger than sellers.
When this alignment appears, traders say the market has bullish momentum.
3. EMA Compression: When the Market Is Resting
Markets rarely move in one direction forever. After a strong move, they often slow down.
You can see this when EMA9 and EMA21 start moving closer together.
This is called EMA compression.
It means:
Momentum is slowing
Buyers and sellers are balancing out
The market is building energy for the next move
Think of it like a spring being compressed before it releases.
During this phase the market may move sideways or slightly down.
4. EMA Expansion: When Momentum Returns
After compression, the market eventually chooses a direction.
If price breaks above the EMAs and the lines begin to separate again, we see EMA expansion.
Structure becomes:
Price
EMA9
EMA21
EMA200
This separation shows that momentum has returned and the trend may continue.
Often this is when large candles appear.
5. The Role of RSI
RSI helps confirm momentum.
Typical RSI zones:
Above 60 → strong bullish momentum
Around 50 → neutral / resting market
Below 40 → bearish pressure
For example:
When RSI rises from 50 to 65, it often confirms that buyers are gaining strength.
When RSI drops back near 50, the market is usually cooling down or consolidating.
6. Why EMA200 Matters
EMA200 is often used as the major trend filter.
A simple rule many traders follow:
Price above EMA200 → bullish market bias
Price below EMA200 → bearish market bias
On a 5-minute chart, EMA200 often acts like a gravity line that price returns to after large moves.
7. The Typical Market Cycle
What we learned today shows that markets often move in a repeating cycle:
Compression → Breakout → Expansion → Pullback → Continuation
Understanding this cycle helps traders avoid chasing price and instead wait for better entries.
8. The Key Lesson
The most important takeaway is that trends are not random.
By observing:
EMA alignment
EMA compression
EMA expansion
RSI momentum
Traders can begin to understand when the market is resting and when momentum is building.
Final Thoughts
Indicators like EMAs and RSI are not magic tools that predict the future. Instead, they help traders read the story the market is already telling.
With practice, these simple concepts can make charts far less confusing and help traders make more disciplined decisions.
The goal is not to predict every move — it is to understand the structure of the market.