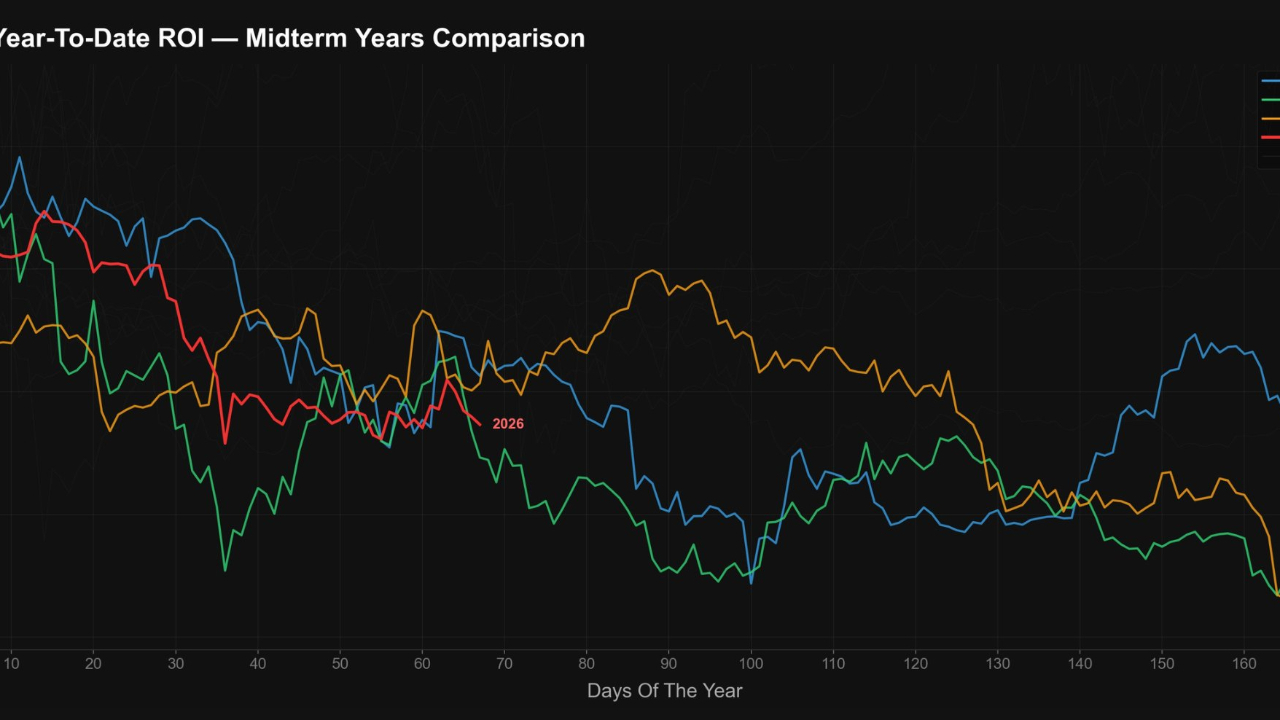
Looking at the ROI (return on investment) comparison chart of Bitcoin during the "Midterm" years, there seems to be a concerning correlation for the current period.
Below are the key points drawn from this seasonal characteristic:
1. General trend: The "faltering" at the beginning of the year
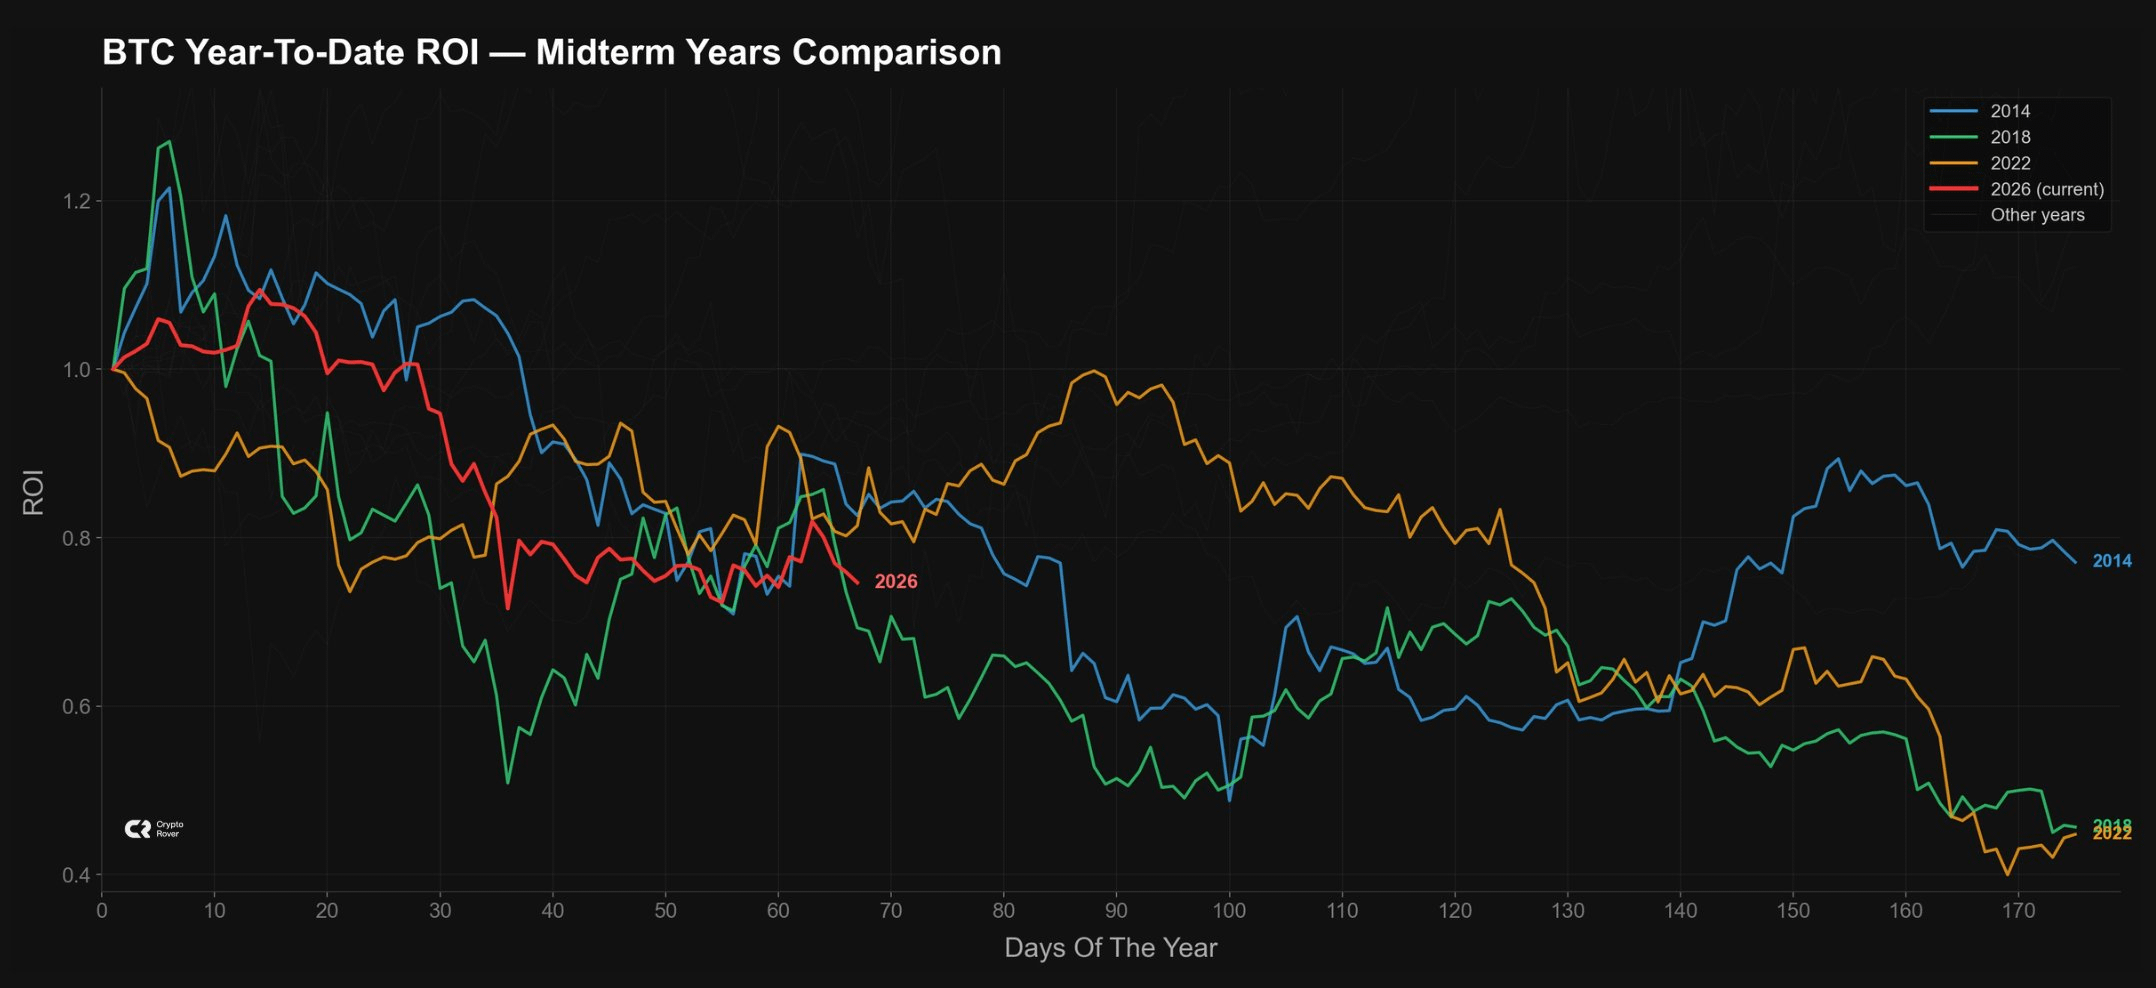
In all 4 cycles compared (2014, 2018, 2022, and currently 2026), Bitcoin tends to reach a short-term peak very early (within the first 20 days of the year) and then begins a long-term decline.
Red line (2026): Closely following the trends of 2018 (green) and 2022 (yellow). After about the 60th day, ROI dropped below 0.8 (meaning a decrease of more than 20% compared to the beginning of the year).
Danger zone: If history repeats exactly the "script" of previous midterm years, we are at the beginning of a deeper decline phase, usually lasting until the 100th - 110th day of the year (around mid-April).
2. Notable milestones on the chart
Days 60 - 80: This is usually the phase of a "bull trap". You may see the red line showing signs of flattening or slight rebound, but previous years have recorded the next drop right after.
Days 100 - 120: The bottom often appears around this phase before technical rebounds.
End of the cycle (Days 170+): Most midterm years end the first half of the year with record low ROI (around 0.4 - 0.6), meaning the value is halved compared to the peak at the beginning of the year.
3. Why "Down"?
This seasonal characteristic is often related to macro factors and cyclical psychology:
Tightening pressure: Midterm years are often when fiscal policies are no longer as "loose" as in election years.
Depletion of momentum: After a year of previous growth, the market needs a strong "shakeout" phase to shake off high leverage orders.
Advice for this phase:
With the 2026 line "copy-pasting" quite accurately previous downtrend years, prioritizing risk management and maintaining a high stablecoin ratio is essential. The "Downtrend" in the short and medium term is being reinforced by historical data.


