The PHA chart has delivered mixed signals in the last hours. While the price shows a drop of -9.47% (0.0344), the technical notes indicate that there may be more fuel to burn. Let's decipher:
🔍 Technical Scenario:
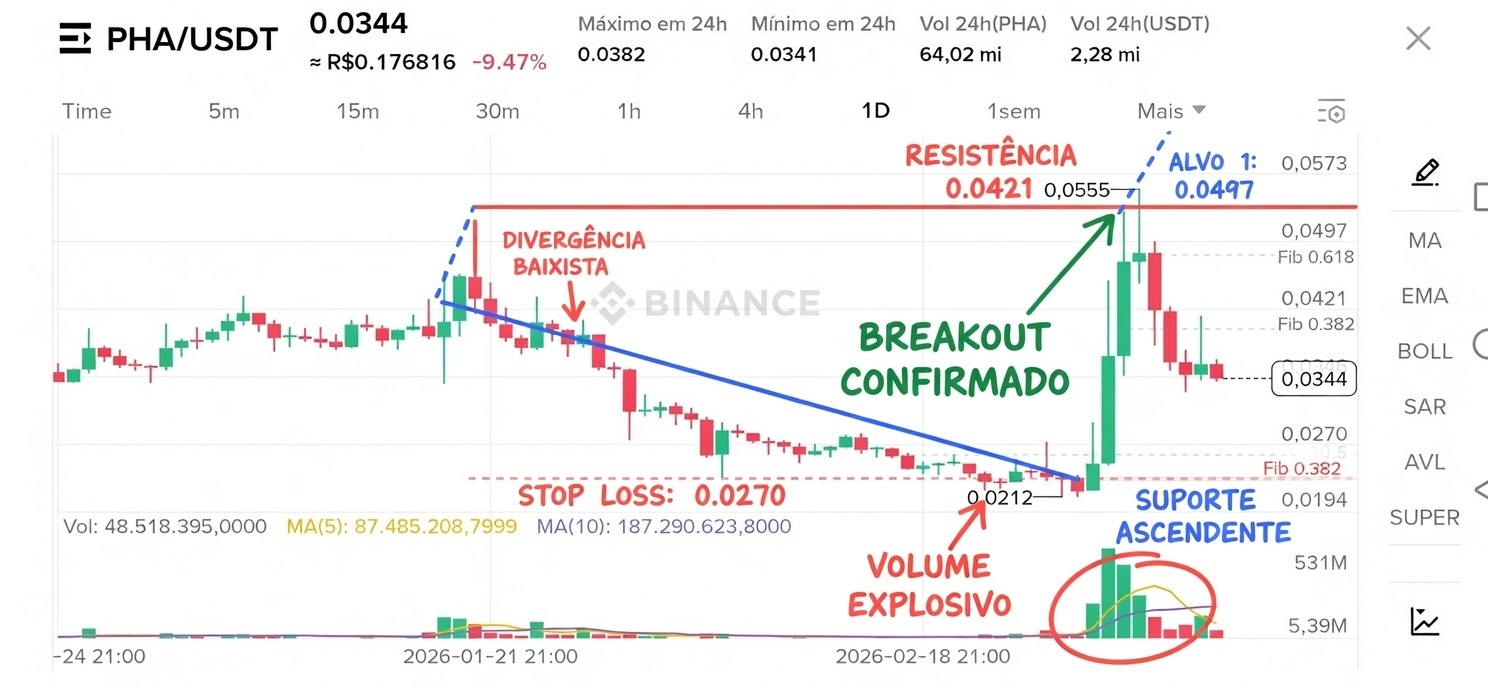
- Bearish Divergence identified – This means that, even with possible price increases, the momentum may be losing strength. Warning sign for compulsive buying.
- Confirmed Breakout – On the other hand, there is a structural break, which suggests that the current movement may have legs.
- Ascending Support being tested – The long-term support line is in action. If it holds, it could be a reversal point.
- Explosive Volume – The increase in volume (64M PHA in 24h) indicates active participation, which validates the movement.
🎯 Crucial Levels:
- Suggested Stop Loss: 0.0270 (below support, protection against larger drops).
- Target 1: 0.0497 (close to the Fib level 0.382)
- Target 2: 0.0573 (Fib 0.618)
📊 Indicators in focus: Averages (MA5 and MA10), Bollinger Bands, SAR, and AVL.
👉 My reading: The bearish divergence requires caution, but the breakout and explosive volume cannot be ignored. The price is at a crossroads: if it maintains the ascending support and breaks resistances, the targets become viable. If it loses the stop, the drop may accelerate.
Strategy: Partial entry on confirmation of support, with adjusted stop. Wait for a breakout of 0.038 (max 24h) to add position.
Would you risk this operation? Do you prefer to wait for more confirmations? Tell me in the comments! 👇📊
#PHA #Altcoins #TechnicalAnalysis #Trading #BinanceFeed $PHA #TrumpSaysIranWarWillEndVerySoon #JobsDataShock #RFKJr.RunningforUSPresidentin2028 #Trump'sCyberStrategy #MetaBuysMoltbook