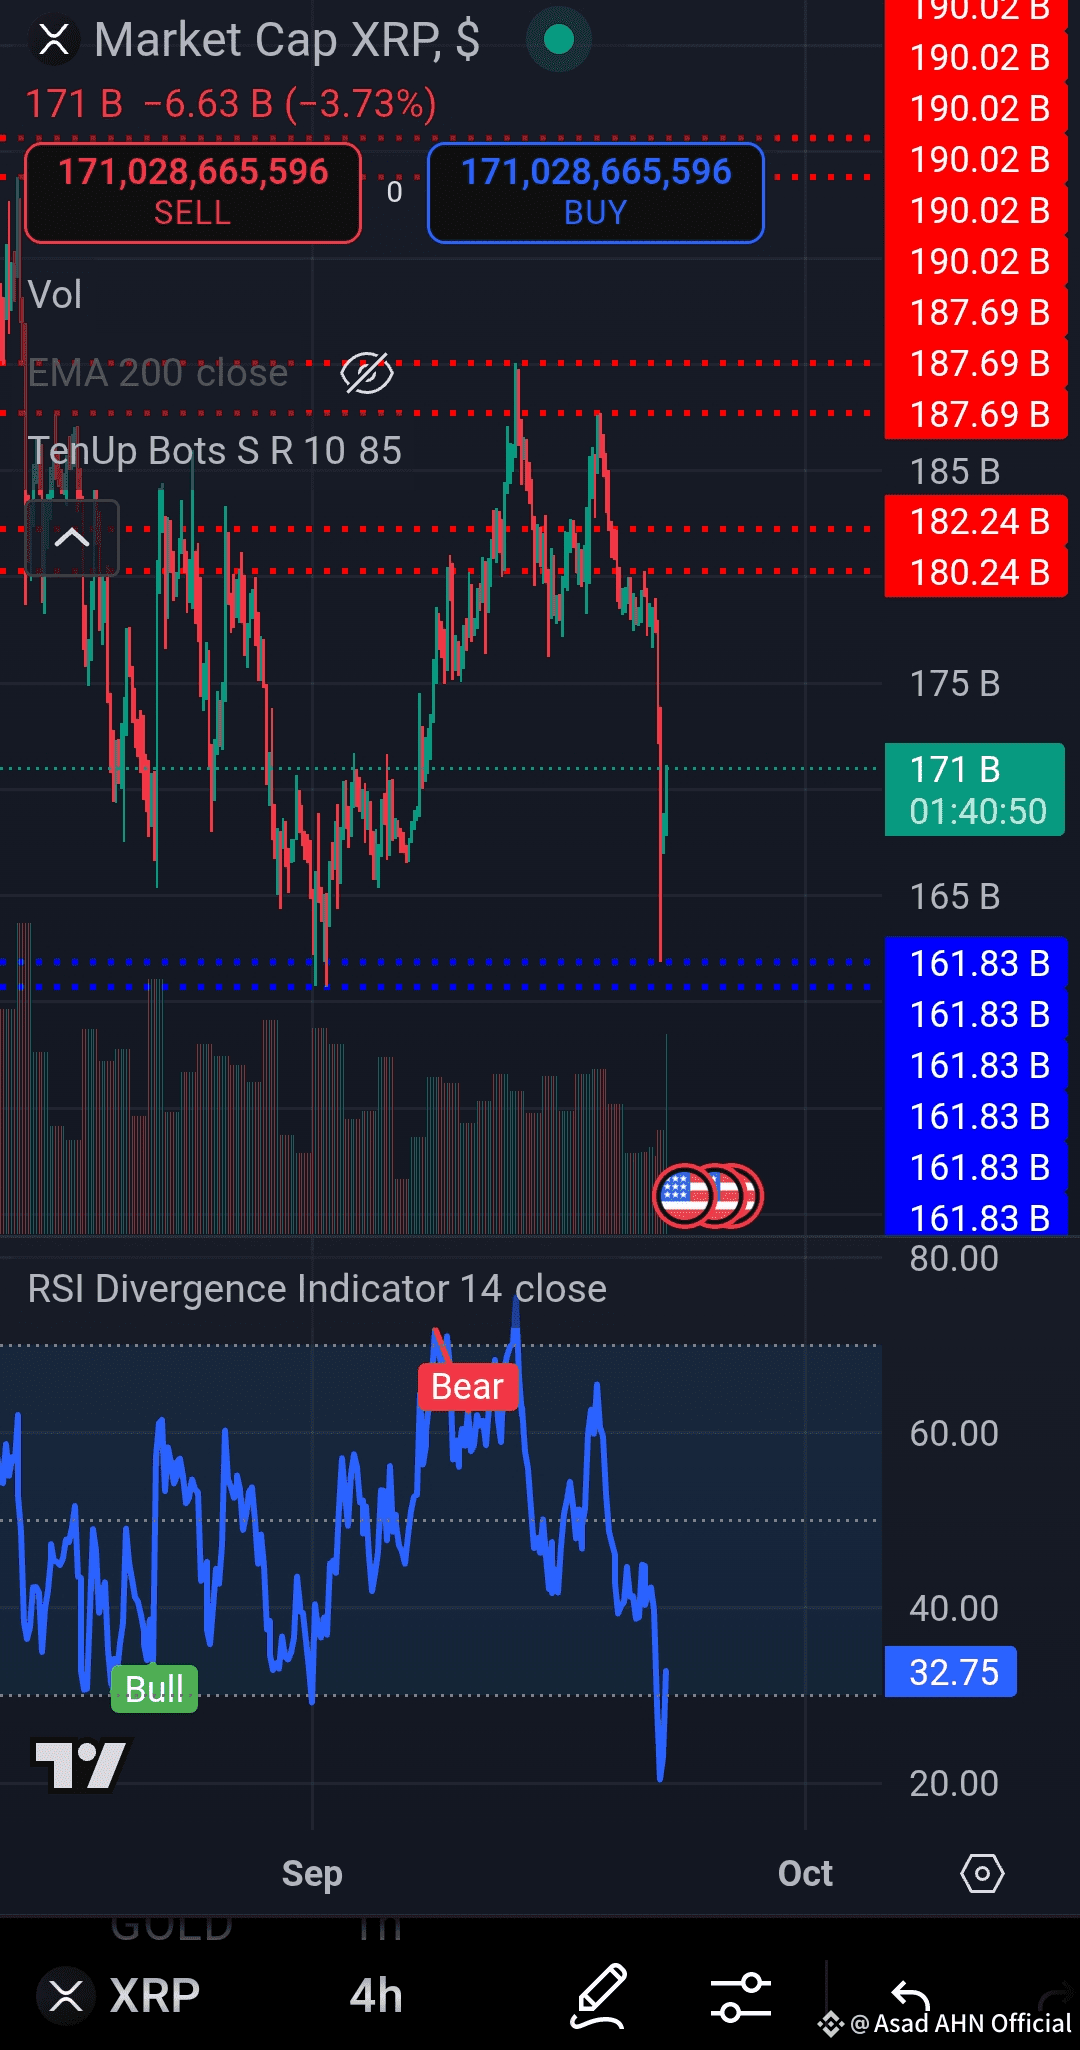
$XRP – 4H Chart Breakdown 📊
1. Price Action
A strong bearish candle sliced through key supports: MA50 (3.0154), MA100 (2.9926), and MA150 (2.9380).
Price rebounded from the 2.6813 local low and is now at 2.8124, hinting at a potential short-term bounce.
2. Moving Averages (Trend)
Alignment: MA50 < MA100 < MA150 < MA200 → confirms bearish structure.
Trading below all major MAs = clear bearish trend.
3. Volume
Heavy red volume spike signals intense selling.
The rebound came on weaker green volume → buyers not convincing yet.
4. RSI (14) – 21.55
Deep in oversold territory (<30).
Suggests a possible relief rally, but overall bias still bearish.
5. Stochastic RSI – 1.94
Extremely oversold.
Indicates bounce potential, though confirmation depends on stronger buying.
6. MACD
Bearish histogram expanding.
Momentum still favors sellers until it begins to flatten.
---
🔮 Outlook (Next 4H–24H):
Upside: Possible bounce/retest toward 2.86 – 2.90 (resistance).
Downside: Rejection could push back to 2.68. A breakdown below 2.68 opens the door to 2.55 – 2.58.
Bullish reversal only if price closes above 2.95–3.00 with strong buying volume.
---
✅ Bias: Overall bearish trend, but oversold conditions may allow a short-term relief rally before downside continuation unless strong buyers step in.
#XRPRealityCheck #XRPMarketUpdate