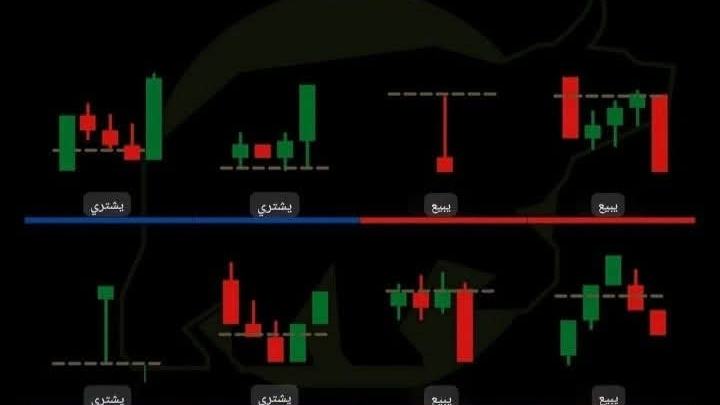
Candlestick Signals practically: when to consider the candle a buy (BUY) and when to consider it a sell (SELL) based on the shape of the body, the wick, and the closing position.
I will explain each pattern exactly like the image (from left to right):
⸻
✅ BUY signals
1) Top left — bullish reversal after a drop
•Small red candles in succession (double the seller)
•After that, a strong bullish engulfing candle (Bullish Engulfing or Strong Reversal Candle)
✅ Meaning: Seller has ended + liquidity entering = Beginning of a rebound/Bullish trend
📌It's best if it appears at:
•Support
•EMA50/EMA200
•Wave bottom
⸻
2) Top middle — Accumulation then breakout
•Several small candles near the support level (Equilibrium)
•Then a strong green candle breaks upward
✅ Meaning: Breakout from accumulation range (Launch pad)
⸻
3) Bottom left — Hammer / Bullish Pin bar
•Very long lower wick + small body
✅ Meaning: The bottom was broken during the candle but returned and closed above ⇒ Strong rejection of the decline
Strength condition:
•The wick is 2–3 times longer than the body
•The close is near the top of the candle
⸻
4) Bottom middle — Morning Star
3 candles:
1.Strong red candle
2.Small candle/indecision
3.Strong green candle
✅ Meaning: Transfer of control from seller to buyer = Clear bullish reversal
⸻
❌ SELL signals
5) Top middle right — Bearish Pin bar / Shooting star
•Long upper wick + small body below
✅ Meaning: The peak was broken during the candle then returned and closed below ⇒ Strong rejection of the rise (Distribution)
If it appears at:
•Resistance
•Wave peak
•After a sharp rise
6) Top right — Bearish reversal after rise
•Rise with small green candles
•Then a strong red candle descends and breaks
✅ Meaning: Beginning of correction/Bearish trend (Bearish reversal)
7) Bottom middle right — Bearish Engulfing / Strong bearish candle
•Small green candles
•Then a large red candle engulfs it
✅ Meaning: Strong selling entry + Buyers exiting
8) Bottom right — Failed to break the peak then broke
•Attempt to rise then red candle
✅ Meaning: Quantities were distributed then reversal
Practical summary (most important)
Candle signals alone are not enough. Their true strength appears if combined with:
✅ Important place:
•Support/Resistance
•EMA200 or EMA50
•Wave peak/trough
✅ Confirmation:
•Increased Volume
•Break/penetration of level + clear closing
•RSI reverses (from below 50 to above in buying, or breaking 50 downwards in selling#تعليم_تداول #تداول_العملات_المشفرة #تحليل_العملات_الرقمية #عالم_العملات_الرقمية #العملات_الرقميه