Analysis date: 13/03/2026
Bitcoin (BTC), the world's leading cryptocurrency, continues to attract the attention of investors with significant volatility in the market. Based on the BTC/USDT trading chart on Binance, we can clearly observe a breakout from the range where the price has been stuck recently. This analysis will focus on key technical factors, including order block, retest, and potential signals for the upcoming trend.
 Market Context and Analysis Chart
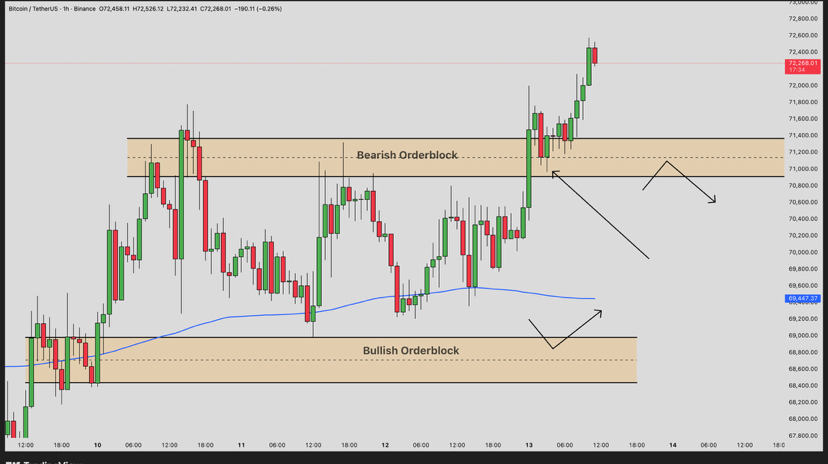
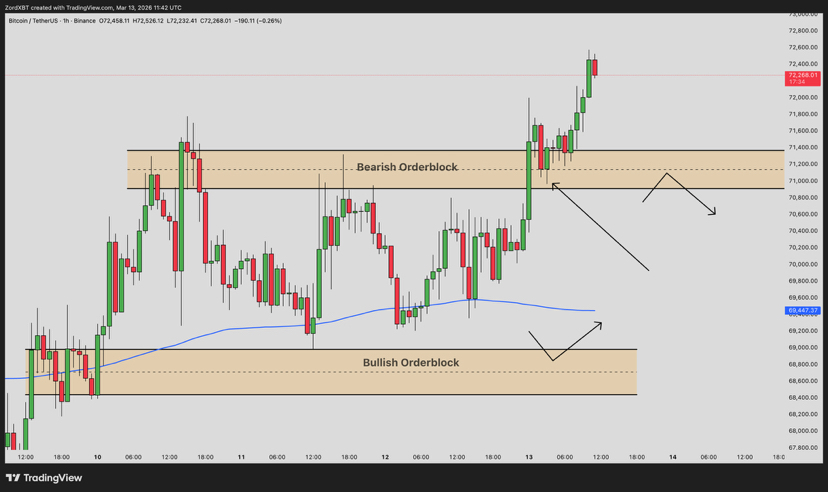
The hourly candlestick chart shows that Bitcoin has undergone a price accumulation phase within a narrow range, oscillating between key support and resistance levels. Specifically, the price has been capped by the Bullish Order Block at the lower range (around 68,000 - 69,000 USD) and the Bearish Order Block at the upper range (around 71,200 - 71,400 USD). These order blocks represent areas where significant supply or demand has previously emerged, often serving as important support/resistance levels.
From the chart, we can clearly see the breakout from this range, with the price rising sharply from the lower area and showing no signs of a larger "sweep" – meaning there is no false price sweep to grab liquidity before the reversal. Instead, the price has clearly retested the order block before bouncing. This is evidenced by the strong green candles after hitting the support level, combined with the moving average (possibly EMA or SMA, represented by the blue curve) trending upwards, supporting the bullish momentum.
The current price is hovering around 72,000 USD, with a slight recent decline but still maintaining above important levels. This volatility occurs in the context of the crypto market recovering after macroeconomic events, including stable inflation and expectations regarding interest rates from the Fed.
Key Technical Factors
- Breakout From the Range: Bitcoin has decisively broken out of the range, with high trading volume at breakout points. This indicates a shift from the accumulation phase to an upward trend, possibly due to inflows from institutional investors or optimism from recent Bitcoin ETFs.
- Retest and Bounce at Order Block: After the breakout, the price retested the Bearish Order Block (the yellow area above) in a "clean cut" manner – meaning there was no deep violation, but rather a quick bounce. This reinforces the validity of the breakout, as a successful retest is often a confirming signal for a new trend.
- Signals From the Moving Average: The blue curve (likely the EMA 50 or similar) is supporting the price from below, with an upward arrow at the Bullish Order Block and a downward arrow at the Bearish Order Block, emphasizing potential reversal areas.
Short-Term Outlook and Predictions
If Bitcoin can close the daily candle above the Bearish Order Block (the yellow area around 71,200 USD), this will be a strong signal for a bullish phase lasting several days. In this case, the price could aim for the next resistance levels like 73,000 - 74,000 USD, even higher if trading volume remains. Conversely, if the price fails to maintain above this level and the retest fails, we may witness a pullback to the Bullish Order Block, opening up buying dip opportunities for long-term investors.
However, investors need to be aware of the risks, including high volatility in the crypto market and external factors such as government regulations or global economic fluctuations. It is always recommended to use strict risk management, such as a stop-loss at key order block levels.
Current technical analysis shows that Bitcoin is in a positive position after the breakout, with retest and bounce signals supporting the upward trend. Monitoring the daily candle close will be key to confirming the short-term bullish trend. Investors should combine this analysis with fundamental data to make informed decisions. The crypto market is always full of surprises, but with solid technical tools, opportunities are still leaning towards bullish.