The last 10 days have shown an interesting divergence in the behavior of institutional and retail players. Using the CVD Screener tool, we can see not only the price movement but also whether this movement was accompanied by real aggressive demand.
1. Cardano $ADA : Gradual accumulation
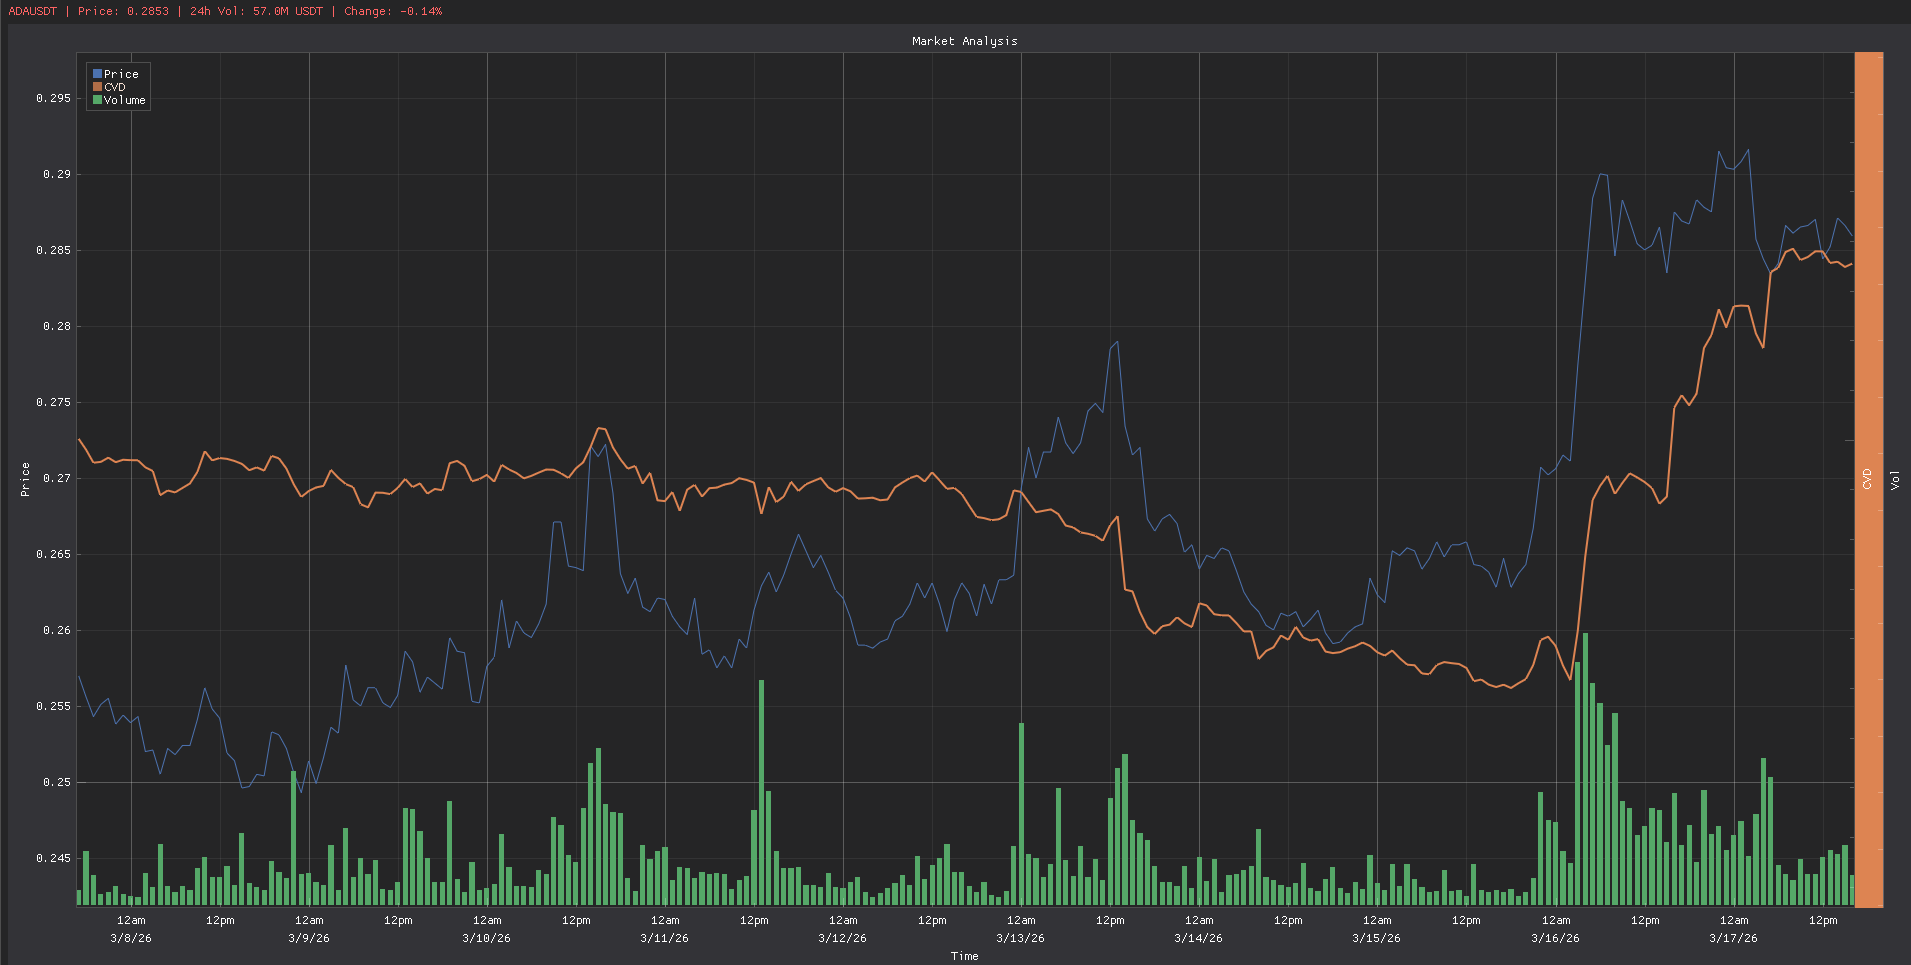
On the ADA chart, a classic pattern of forming a local bottom with a subsequent breakout upwards is observed.
Price dynamics: After a prolonged flat range of $0.255 – $0.275, the coin made a confident leap on March 16, reaching the mark of $0.295.
CVD and volumes: The CVD indicator (orange line) began to rise at an accelerating pace as early as March 15. This indicates that market buyers started aggressively buying up the supply before the main price impulse.
Conclusion: Currently, ADA looks stable. The price increase is confirmed by volumes (green histograms rose at the breakout moment), indicating the strength of the trend.
2. Internet Computer $ICP : Spike in volatility and 'bullish' divergence
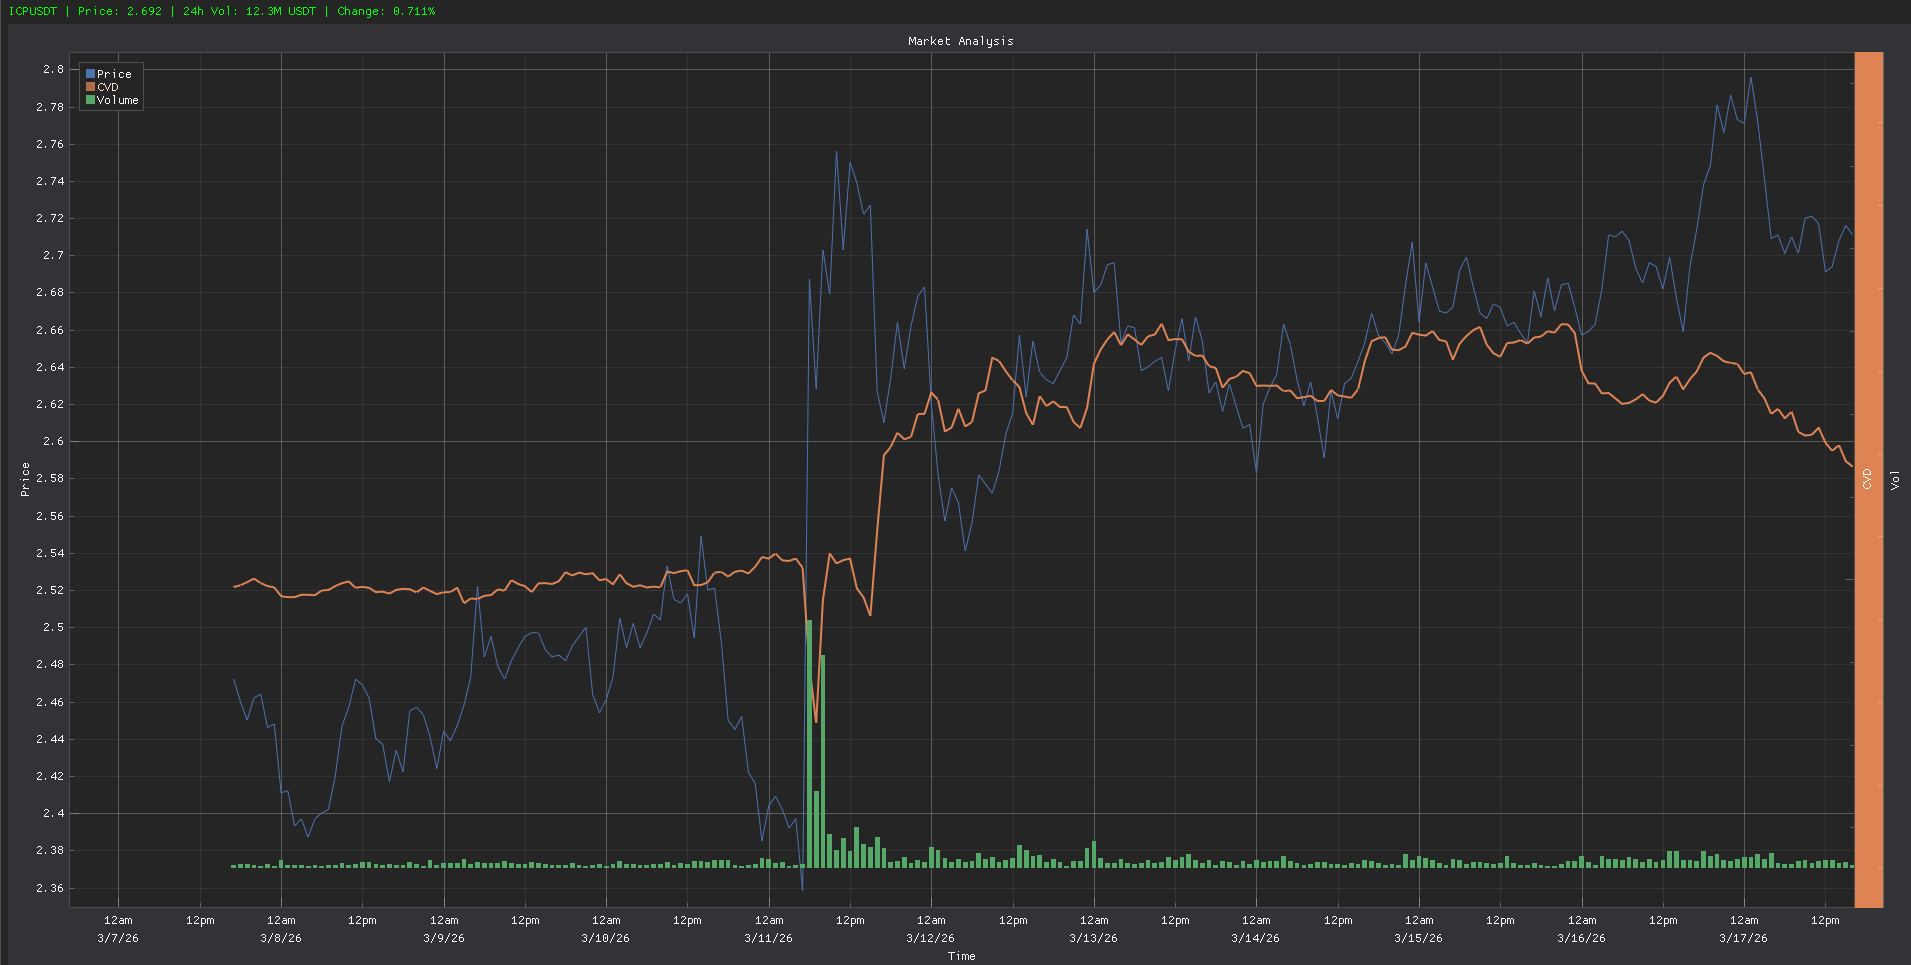
The ICP chart shows the most aggressive trading character among the three assets.
Price dynamics: On March 11, a powerful vertical impulse occurred, lifting the price from $2.50 to nearly $2.75. After this, the asset entered a consolidation phase with a slight upward tilt.
CVD and volumes: The most important point is the gigantic volume spike on March 11. Although after this, the volumes dropped, the CVD line remains at high levels, not falling below values prior to the pump. This means that the big players who entered positions during the impulse are in no hurry to take profits.
Conclusion: ICP is in the 'digestion' phase of volume. Holding the price above $2.65 with stable CVD is a positive signal for continued growth.
3. $NEAR Protocol: Active markup phase
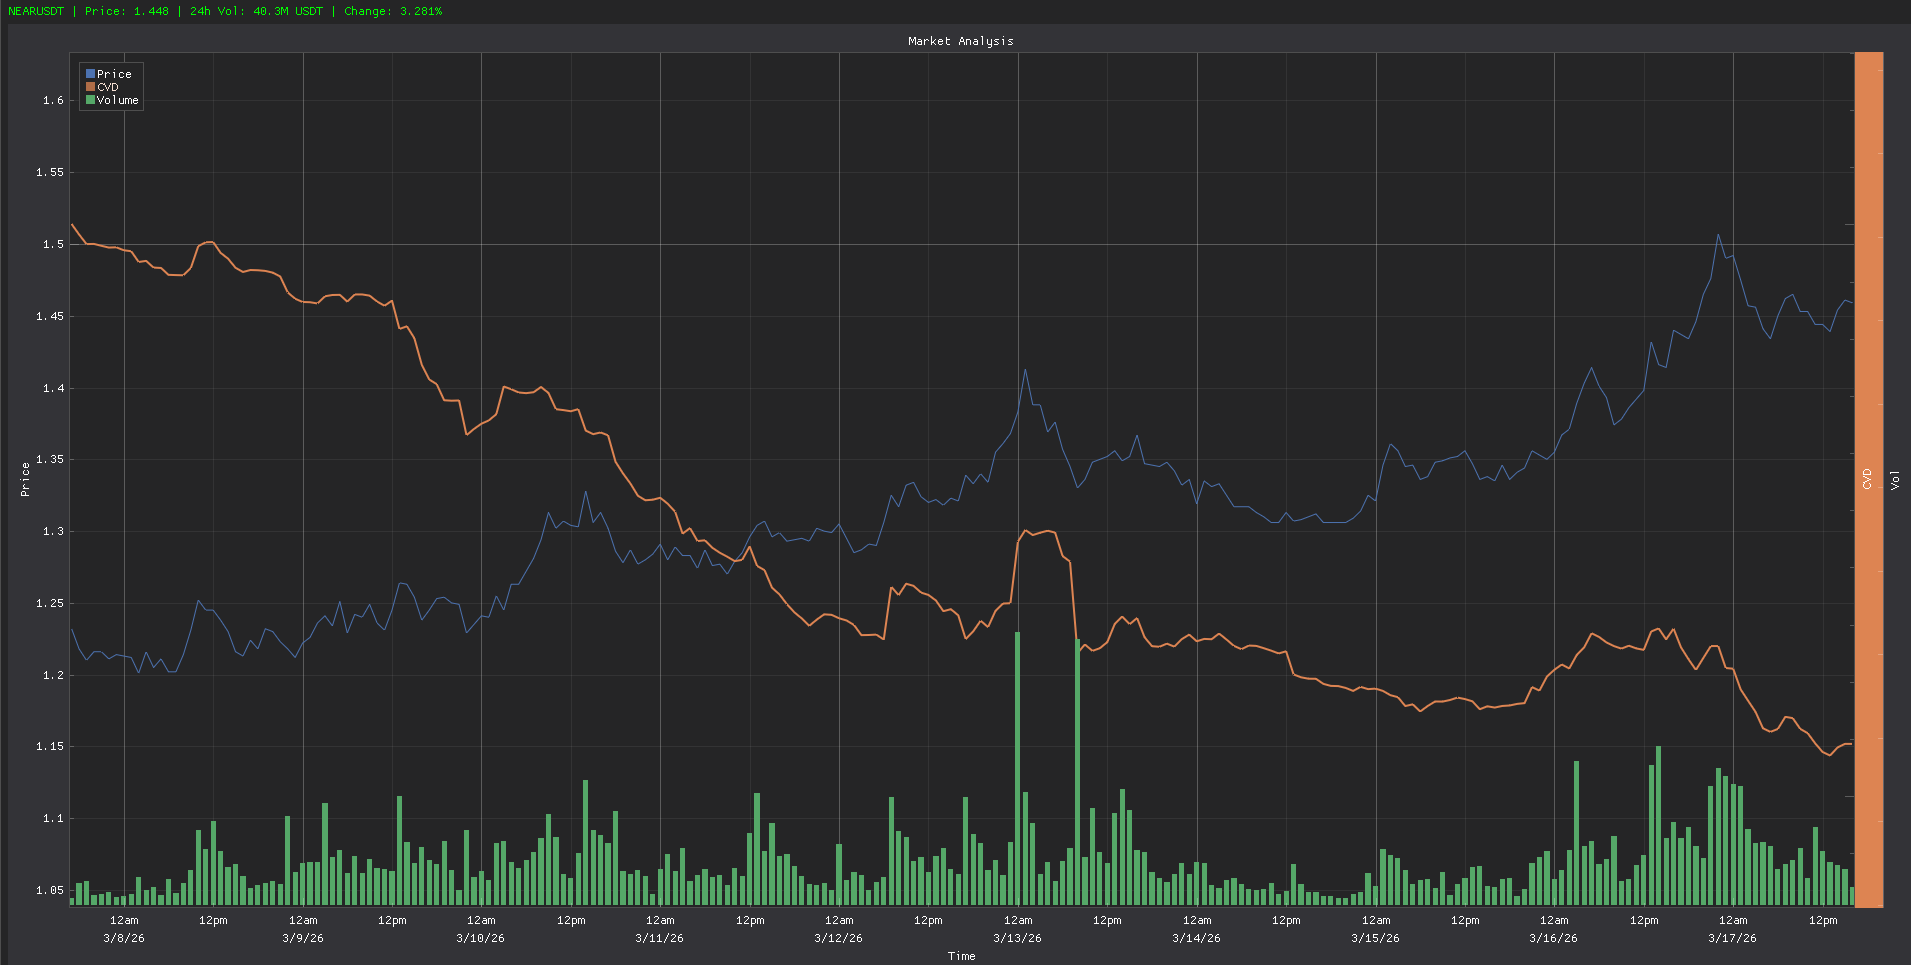
NEAR shows the most 'healthy' trend movement in recent days.
Price dynamics: After a period of decline at the beginning of the week (bottom at $1.25), the coin transitioned to active growth, reaching $1.50 by March 17.
CVD and volumes: Interestingly, the CVD line for NEAR showed a decline during the price rise on March 13-14, which could have been a sign of profit-taking. However, starting from March 16, we see a synchronous increase in price and delta. This confirms that the current rise is initiated by market buyers ('market orders').
Conclusion: NEAR has strong momentum. The last leap was accompanied by significant spikes in volume, making the $1.40 level an important support zone.
Overall summary for 10 days
Analysis of three coins indicates an overall market recovery after March 12.
#ADA — the most reliable accumulation structure.
#ICP — the greatest potential for explosive movement due to abnormal volumes.
#NEAR — the best example of an active trend supported by current market demand.
Do you like this format of analysis? Write in the comments, I also consider suggestions from my subscribers.