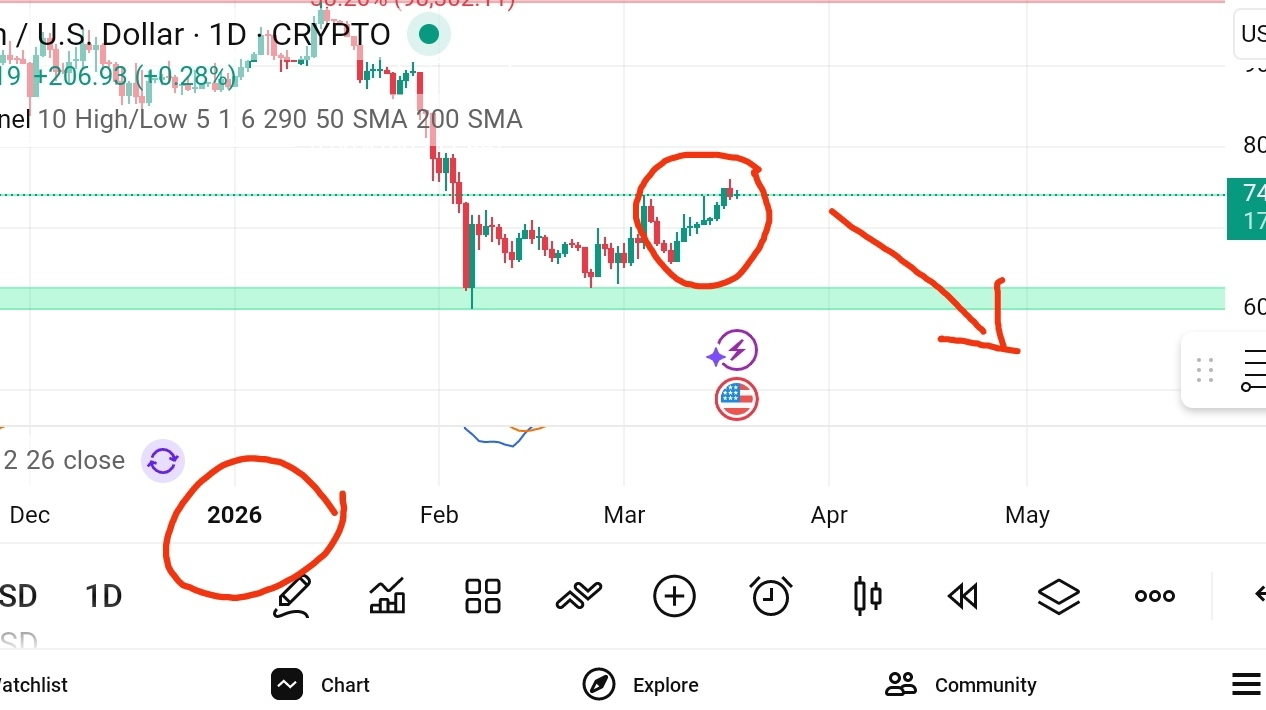
Bitcoin has done it again. 8 consecutive green daily candles. 🔥 Everyone is celebrating, and the media is talking about unprecedented new highs in 2026.
But, as analysts, we must ask: Is this rise genuine or a liquidity trap? 🧐
The historical warning (The Bearish Case):
If we look at the historical data (as we see in the attached picture), the recording of 8 consecutive green candles has always been followed by a sharp correction of at least 20-30%. History does not lie, and this pattern screams "Overbought". 📉
The new surprise in 2026 (The Bullish Case):
Why might "this time be different"? The answer in one word: exchange-traded funds (ETFs).
In 2026, liquidity no longer comes only from individual traders. There are billions of dollars flowing in daily from major financial institutions. They do not sell at the first sign of a technical downturn. They buy the Dip vigorously! 💪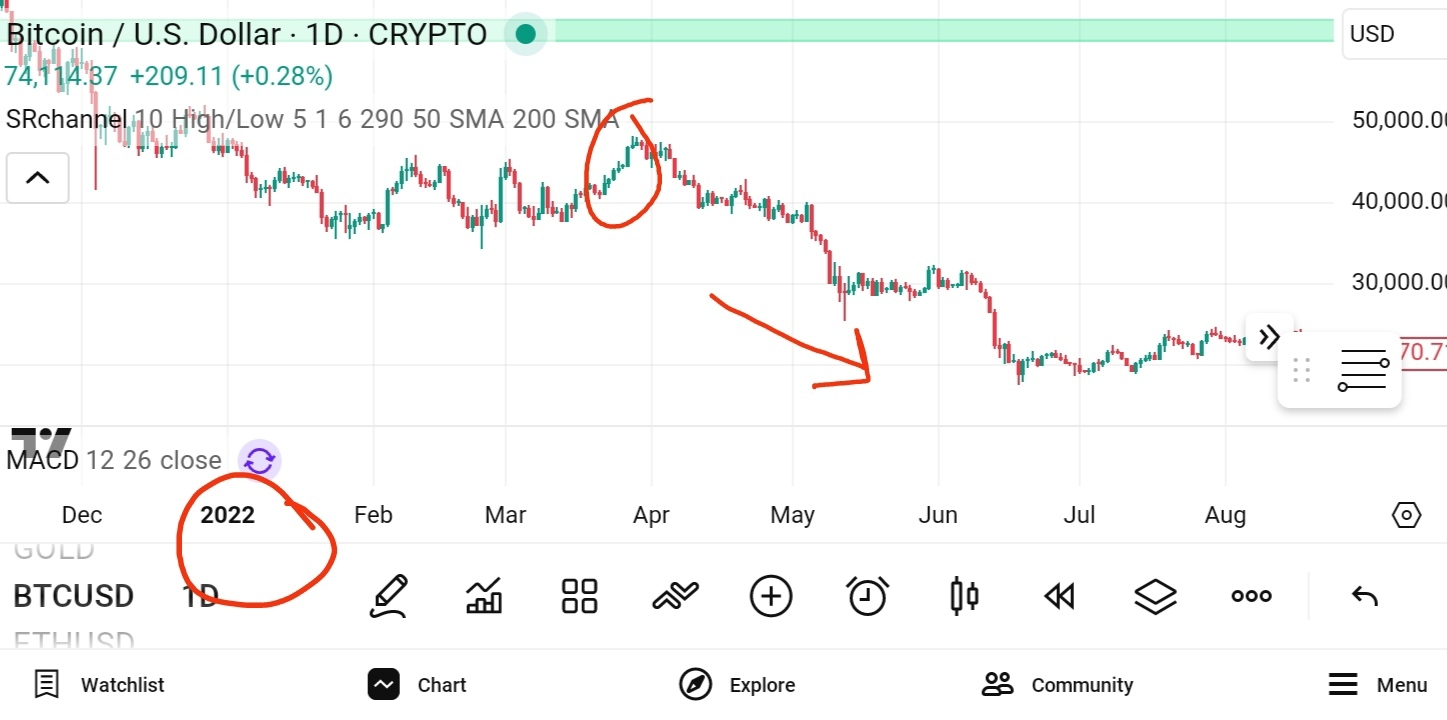
The summary (The Strategy):
We are now in a battle between "technical history" and **"new institutional liquidity"**.
The critical level: If BTC breaks the 75,000 level and closes above it on the ninth candle, we may see an unstoppable price explosion.
The cautious scenario: If a decline begins, the $68,000 levels are the first support for "buying the Dip" with the help of ETFs.
Don’t be a victim of FOMO. Base your strategy on data, not emotions. 🧠
Where do you stand?👇
Do you think the new liquidity will conquer history, or will the "nightmare of 2022" repeat itself? Share your analysis in the comments!
#Bitcoin2026 #ETFFlows #TechnicalAnalysis #TradingStrategy #BinanceSquare #MrCuriousInspired
Article
Important Warning: The "8 Green Candles" pattern faces the ETF funds wall.. Who will prevail in the end? $BTC $BNB $
--