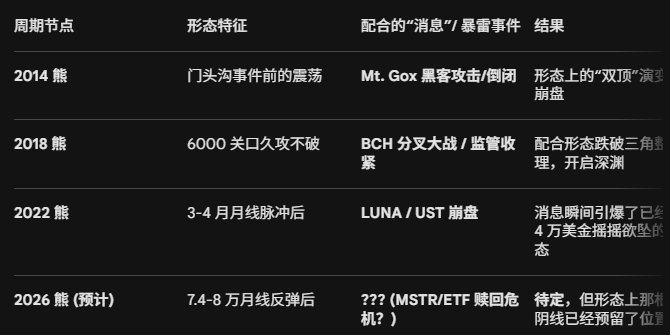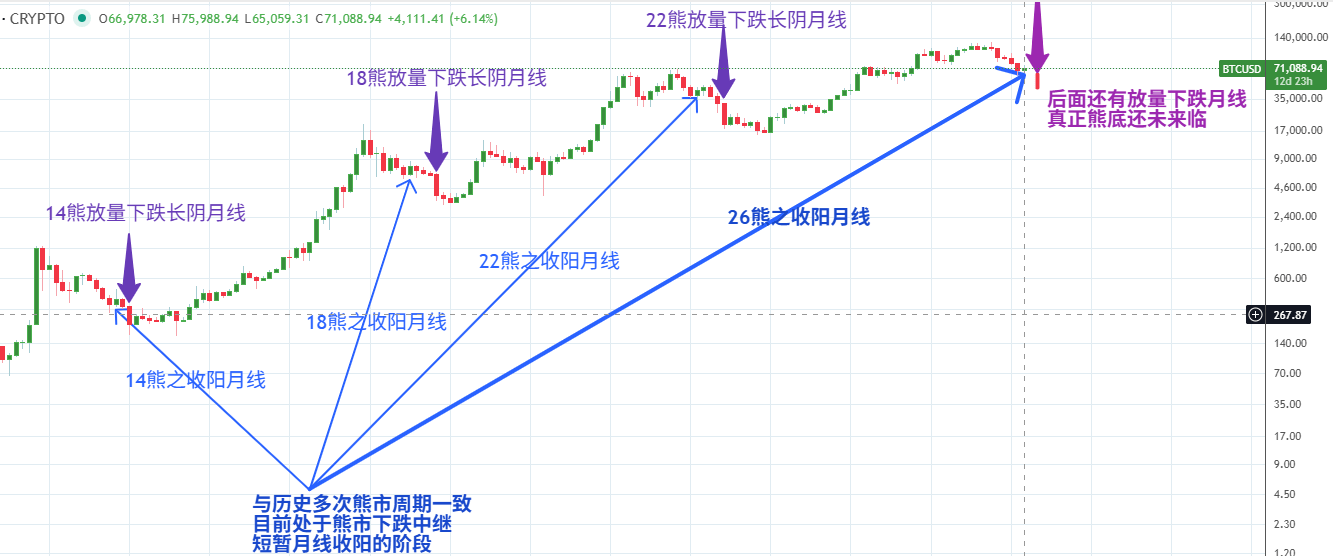
Each cycle, after a big bull market peaks and enters the first year of a bear market (2014, 2018, 2022, 2026), typically features a 'deceptive' monthly-level rebound.
2014 Bear: After experiencing a massive drop at the beginning of the year, we saw a volume-increasing green candlestick on the monthly chart, followed by a prolonged bear trend.
2018 Bear: The famous 'April rebound' led countless traders to believe the bull market had returned, only for the notable $6,000 support level to break.
2022 Bear: A brief pulse in March and April (the last party before the Luna crash), followed by the dual catastrophe of Luna and FTX.
2026 Bear (Current): After peaking at $126,000 at the end of 2025, the current monthly line bounce is in the 'bullish engulfing phase' as marked in the chart.
A. The absence of 'time symmetry'
Analysis: Historically, cycle bottoms usually occur 12-18 months after a halving. It has only been 5 months since the peak in October 2025.
Logic: The market has not yet experienced enough 'attrition'. The current monthly bullish engulfing is more like a technical correction (Mean Reversion) after the overbought conditions of 2025, rather than the start of a new bull market.
B. The contrast between leverage and liquidity
Analysis: The marked 'long bearish candlestick with high volume' usually accompanies deleveraging.
Based on: During this wave of bounce at the beginning of 2026, open interest (OI) hasn't significantly decreased; instead, it has increased alongside the price. This indicates there is still a lot of 'false prosperity' piling up in the market. According to the patterns seen in 14, 18, and 22, a 'devastating long bearish candlestick' is necessary to completely liquidate these long leverages before the bottom can emerge.
C. The 'misalignment' in macro cycles that lures in buyers
Analysis: What sets 2026 apart from the past is the presence of MSTR and ETFs. This causes the bounce to be stronger than before (potentially reaching $75,000 - $79,000 or even more).
Opinion: As marked, this 'strong bullish engulfing' actually makes the next 'high-volume bearish drop' more lethal. Once MSTR's holding cost line (around $75,800) turns into an insurmountable resistance, the collapse of market faith will be more severe than in 2022.
Logic: Even though the larger trend looks bearish, in this 'monthly bullish engulfing' bounce, shorts face extremely high 'squeeze risk (Short Squeeze)'.
Caution:
Liquidity hunt: Before the big drop, the big players must first wash out all the stubborn shorts through a bullish candlestick (the bullish engulfing phase marked in the chart).
Emotional inertia: Bullish candlesticks will lure retail traders into thinking 'the bull market is back', which provides enough counterpart (buying support) for later 'high-volume bearish candlesticks'.
Tactical advice: During the bullish engulfing phase, shorts should act like 'covert snipers', only striking at resonance points (like 0.382/0.5) for precise hits, rather than trying to block the train during the bullish candlestick's rise.
As for the news, that stuff is just there to complement the patterns; you could also say it aligns with the big players who release it at the right moment.


#美联储3月议息会议 #SEC澄清加密资产分类 #美国2月PPI超预期 #加密市场反弹