Entering an exchange and seeing a screen full of red and green candles going up and down may seem like trying to read the Matrix. However, behind that visual chaos lies the psychology of millions of investors. Learning to read charts (Technical Analysis) is the first step to stop gambling and start trading strategically.
Here are the basics for interpreting the market:
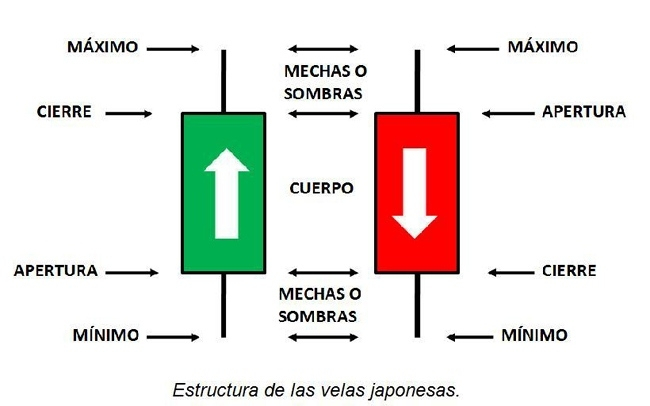
1. The anatomy of Japanese Candles
Each "candle" on the chart represents a period of time (1 hour, 1 day, etc.).
Green Candle (Bullish): The closing price was higher than the opening price. Buyers are in control.
Red Candle (Bearish): The closing price was lower than the opening price. Sellers are in control.
Wicks (shadows): They are the thin lines at the ends of the candle. They indicate the maximum and minimum price reached by the cryptocurrency during that time period.
2. Detecting the Trend
The market never moves in a straight line; it moves in a zig-zag.
Bullish Trend (Uptrend): The chart makes "higher lows" and "higher highs." Basically, like climbing a ladder.
Bearish Trend (Downtrend): The price makes "lower highs" and "lower lows." The ladder goes down.
Lateralization (Range): The price bounces between two horizontal levels without deciding whether to go up or down.
3. Supports and Resistances
Imagine the price bouncing in a room.
Support (The floor): It is a low zone where historically buyers come in strongly and prevent the price from falling further.
Resistance (The ceiling): It is a high zone where sellers take profits, stopping the price from rising.
Conclusion:
No chart predicts the future with 100% accuracy, but reading patterns gives you odds in your favor. Before buying a crypto simply because "it's cheap", look at its chart: is it on support or hitting a resistance? Education is your best indicator.
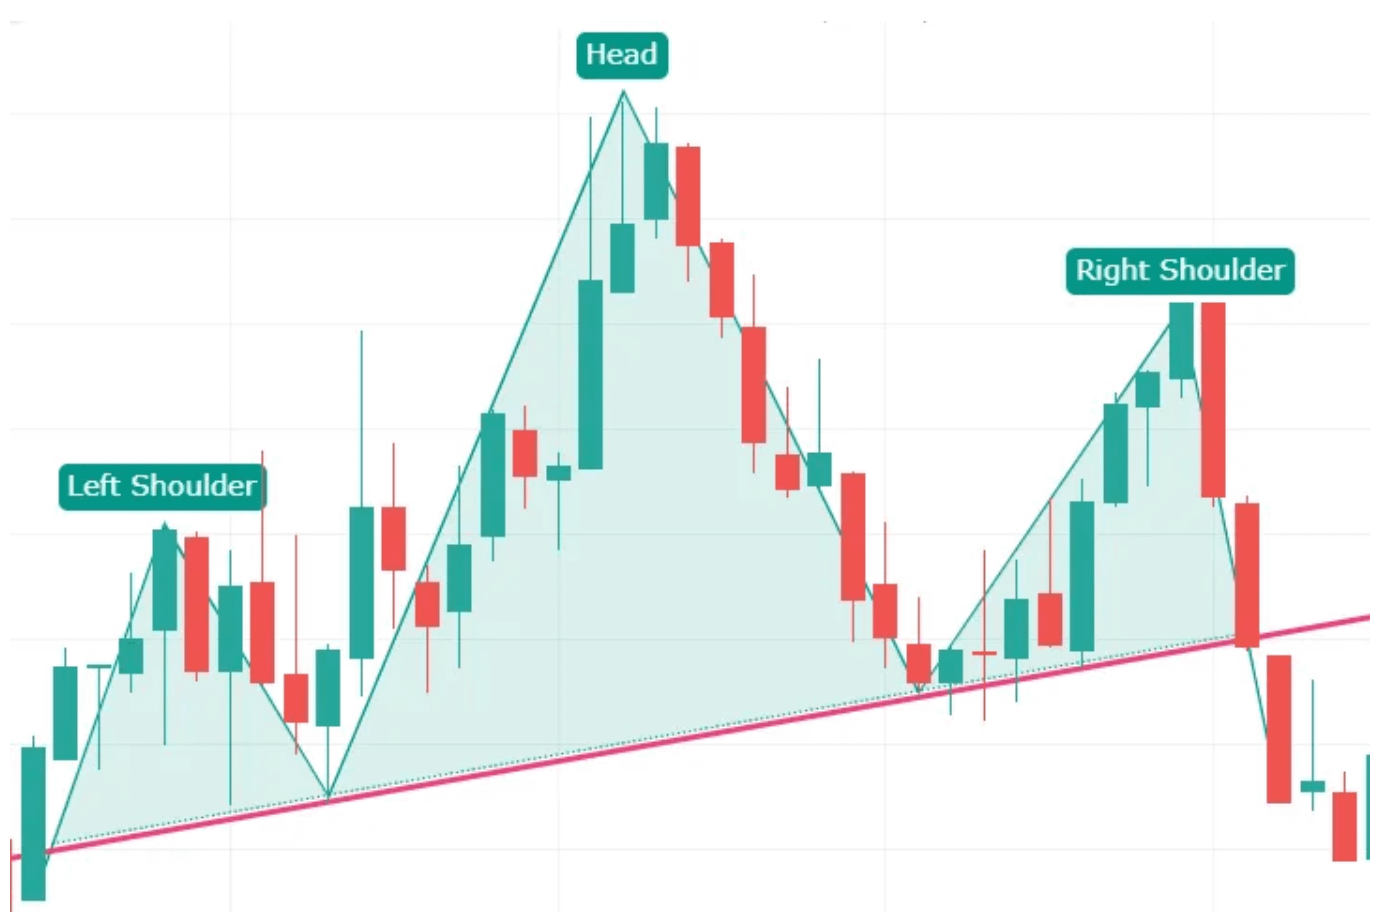
Trend pattern: shoulder — head — shoulder
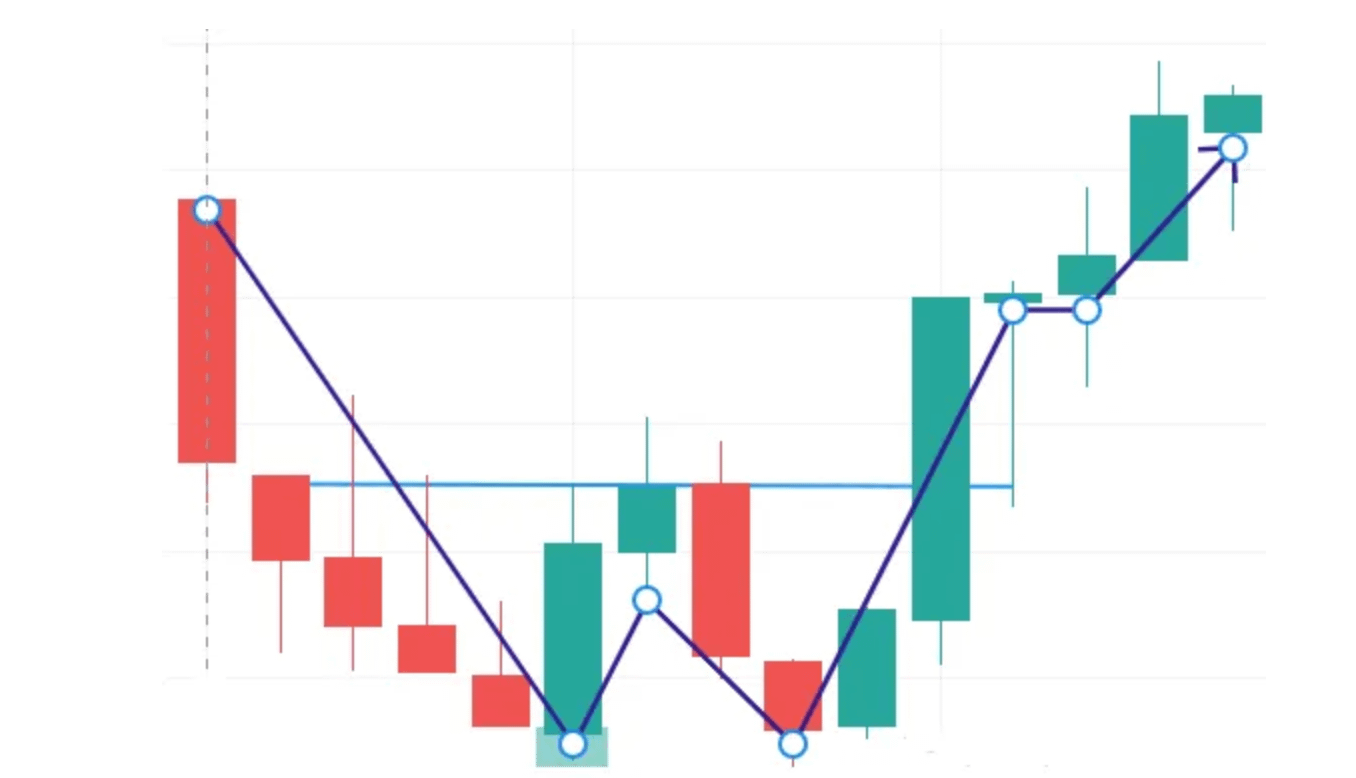
Trend pattern: double bottom
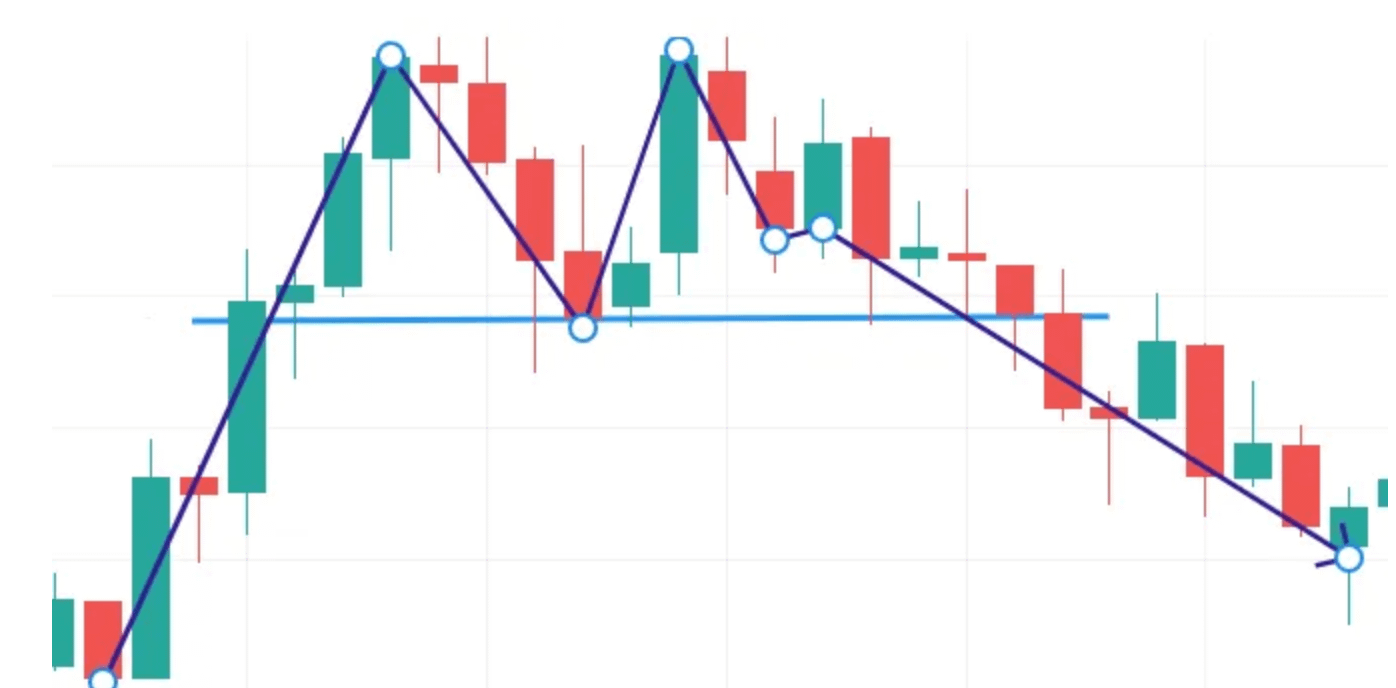
Trend pattern: double top