Hello, everyone! Let's take a look at this monthly chart of PAX Gold (PAXG/USDT) on Binance, with a view of flow and structure, but without losing the context of the real world. Those who follow gold know that it is the thermometer of geopolitical chaos. And here, the chart is telling a very clear story.
🧭 Macro Context (What is happening out there?)
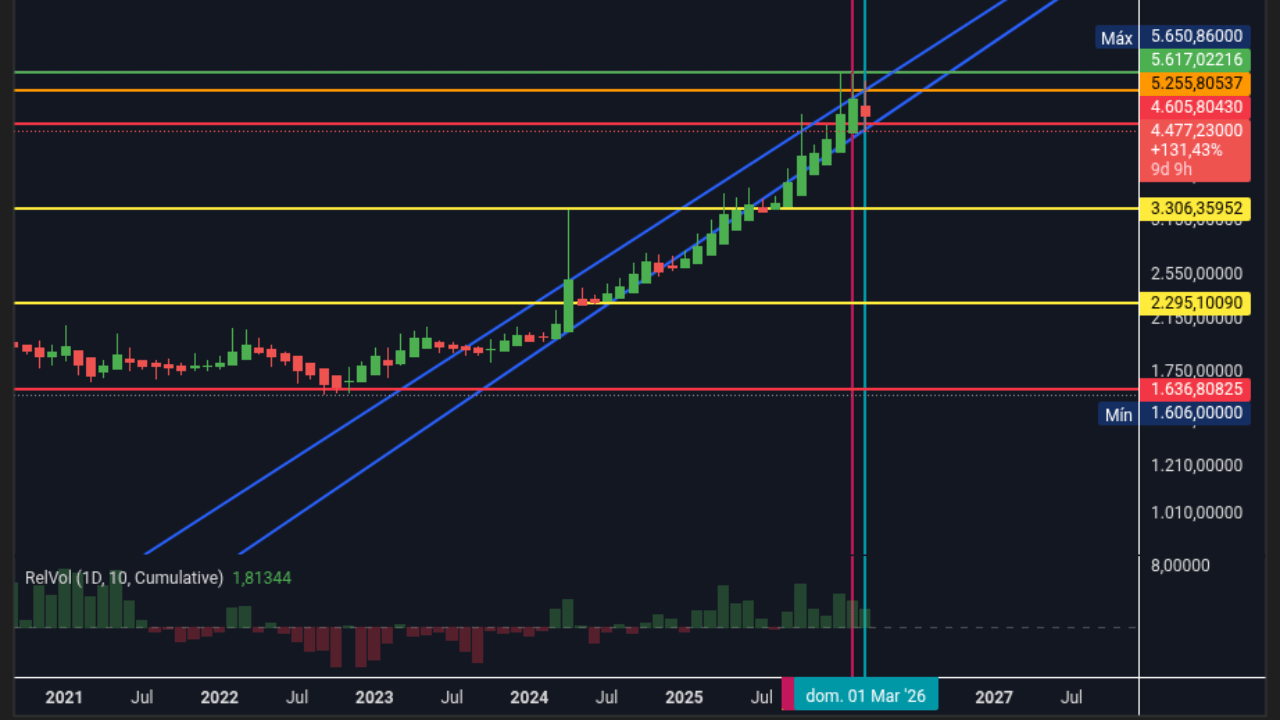
We are looking at the period from 2021 to March 2026. PAXG, which replicates physical gold, has gone through one of the largest rises in recent history. This was not by chance:
2022-2023: Invasion of Ukraine and the energy crisis in Europe. Gold surged from the region of $1,750 to break historical resistances.
2024-2025: Tensions in the Middle East (Israel-Iran conflict) combined with the Fed's interest rate cut cycle. That's when we saw the historic peak near $5,650. It was an aggressive 'flight to quality' rally.
March 2026: The current month shows a correction. Is the market already pricing in a possible lasting ceasefire? Or a currency stabilization? Probably yes. Gold is taking a breather.
📊 Chart Analysis (The Analyst's View)
1. The Great Bull Structure (2021 – 2025)
Observe the robust upward channel. Since the low at $1,750, the asset has respected a sequence of ascending highs and lows. The breakout above $3,300 (old peak of 2020) was the turning point that brought structural (institutional) buyers into the game.
2. The Peak and Rejection at $5,650
The maximum recorded at $5,650 showed a violent rejection. In the monthly chart, we see a 'hammer inverted' or 'shooting star' candle in that region. This indicates buying exhaustion. Those who bought at the peak are holding losing positions now.
3. Current Moment (March/2026)
We are seeing a respectable pullback. The price has returned to the region of $4,940.
Key support: The region of $4,600 (previous minimum). If it loses that, the flow may accelerate towards the long-term moving average around $4,200.
Volume: The Relative Volume is at 1.81, meaning volume is 80% above the average. This is not 'noise' volume. It is conviction volume. However, the conviction now is selling.
💹 Flow Analysis (Order Flow)
On the monthly, what catches my attention is the volume profile:
Volume Profile: The region of $4,400 to $4,800 was where the market transacted the most during this rally. We are floating just above this 'Point of Control' (POC). If the price loses $4,770 (the year's opening), we will see an 'iceberg' of stops triggered, taking the price to seek liquidity at $4,200.
Delta: The March candle is red with an upper shadow. This means there was an attempt to resume the uptrend (buying), but aggressive sellers (market aggressors) dominated the closing. The order flow is negative for the accumulated month.
🌍 Relationship with Geopolitical Events
The drop of -2.52% this month in March 2026 is not an isolated technical movement. It reflects:
Ceasefire in conflicts: Strong speculations of a peace agreement between Russia and Ukraine have gained strength in recent weeks, reducing gold's risk premium.
Dollar Strength: The dollar index (DXY) reacted well to US inflation data released in the first half of March, putting pressure on dollar-denominated commodities.
Profit realization: After the 2025 spike (which was backdroped by the American elections and instability in the Middle East), large funds (asset managers) are reducing exposure to gold to reallocate capital into fixed income or equities, which showed recovery.
🧠 Humanized Conclusion (For those trading)
Analyst: "We are in a zone of indecision on the monthly. The long-term trend is still upward (we are above all long-term averages), but the momentum has turned. If you bought at $3,000 or $4,000, maybe it's time to protect the profit with a trailing stop. If you are short, be careful with the region of $4,600; there is the 'wall' of institutional buyers."
Flow: "The high volume with red closing shows that the 'sharks' are distributing positions. I do not see strength to break $5,200 without a new geopolitical trigger. For now, the flow is 'sell the rallies'."
Summary: Gold rested after a historic rally driven by wars and uncertainties. Now the market breathes and awaits the next move. Keep an eye on the region of $4,600 — if it turns into support, the bull run returns. If it loses, prepare the vests.
Leave your like if you also believe that gold is safe, but the chart doesn't lie! 🚀📉