
As Iran and unstable oil supplies have led to gold entering a bear market, Bitcoin traders still maintain a BTC price target below $50,000.
Bitcoin (BTC) faces new macro risks this week, with gold plummeting significantly, and traders are awaiting the $50,000 mark.
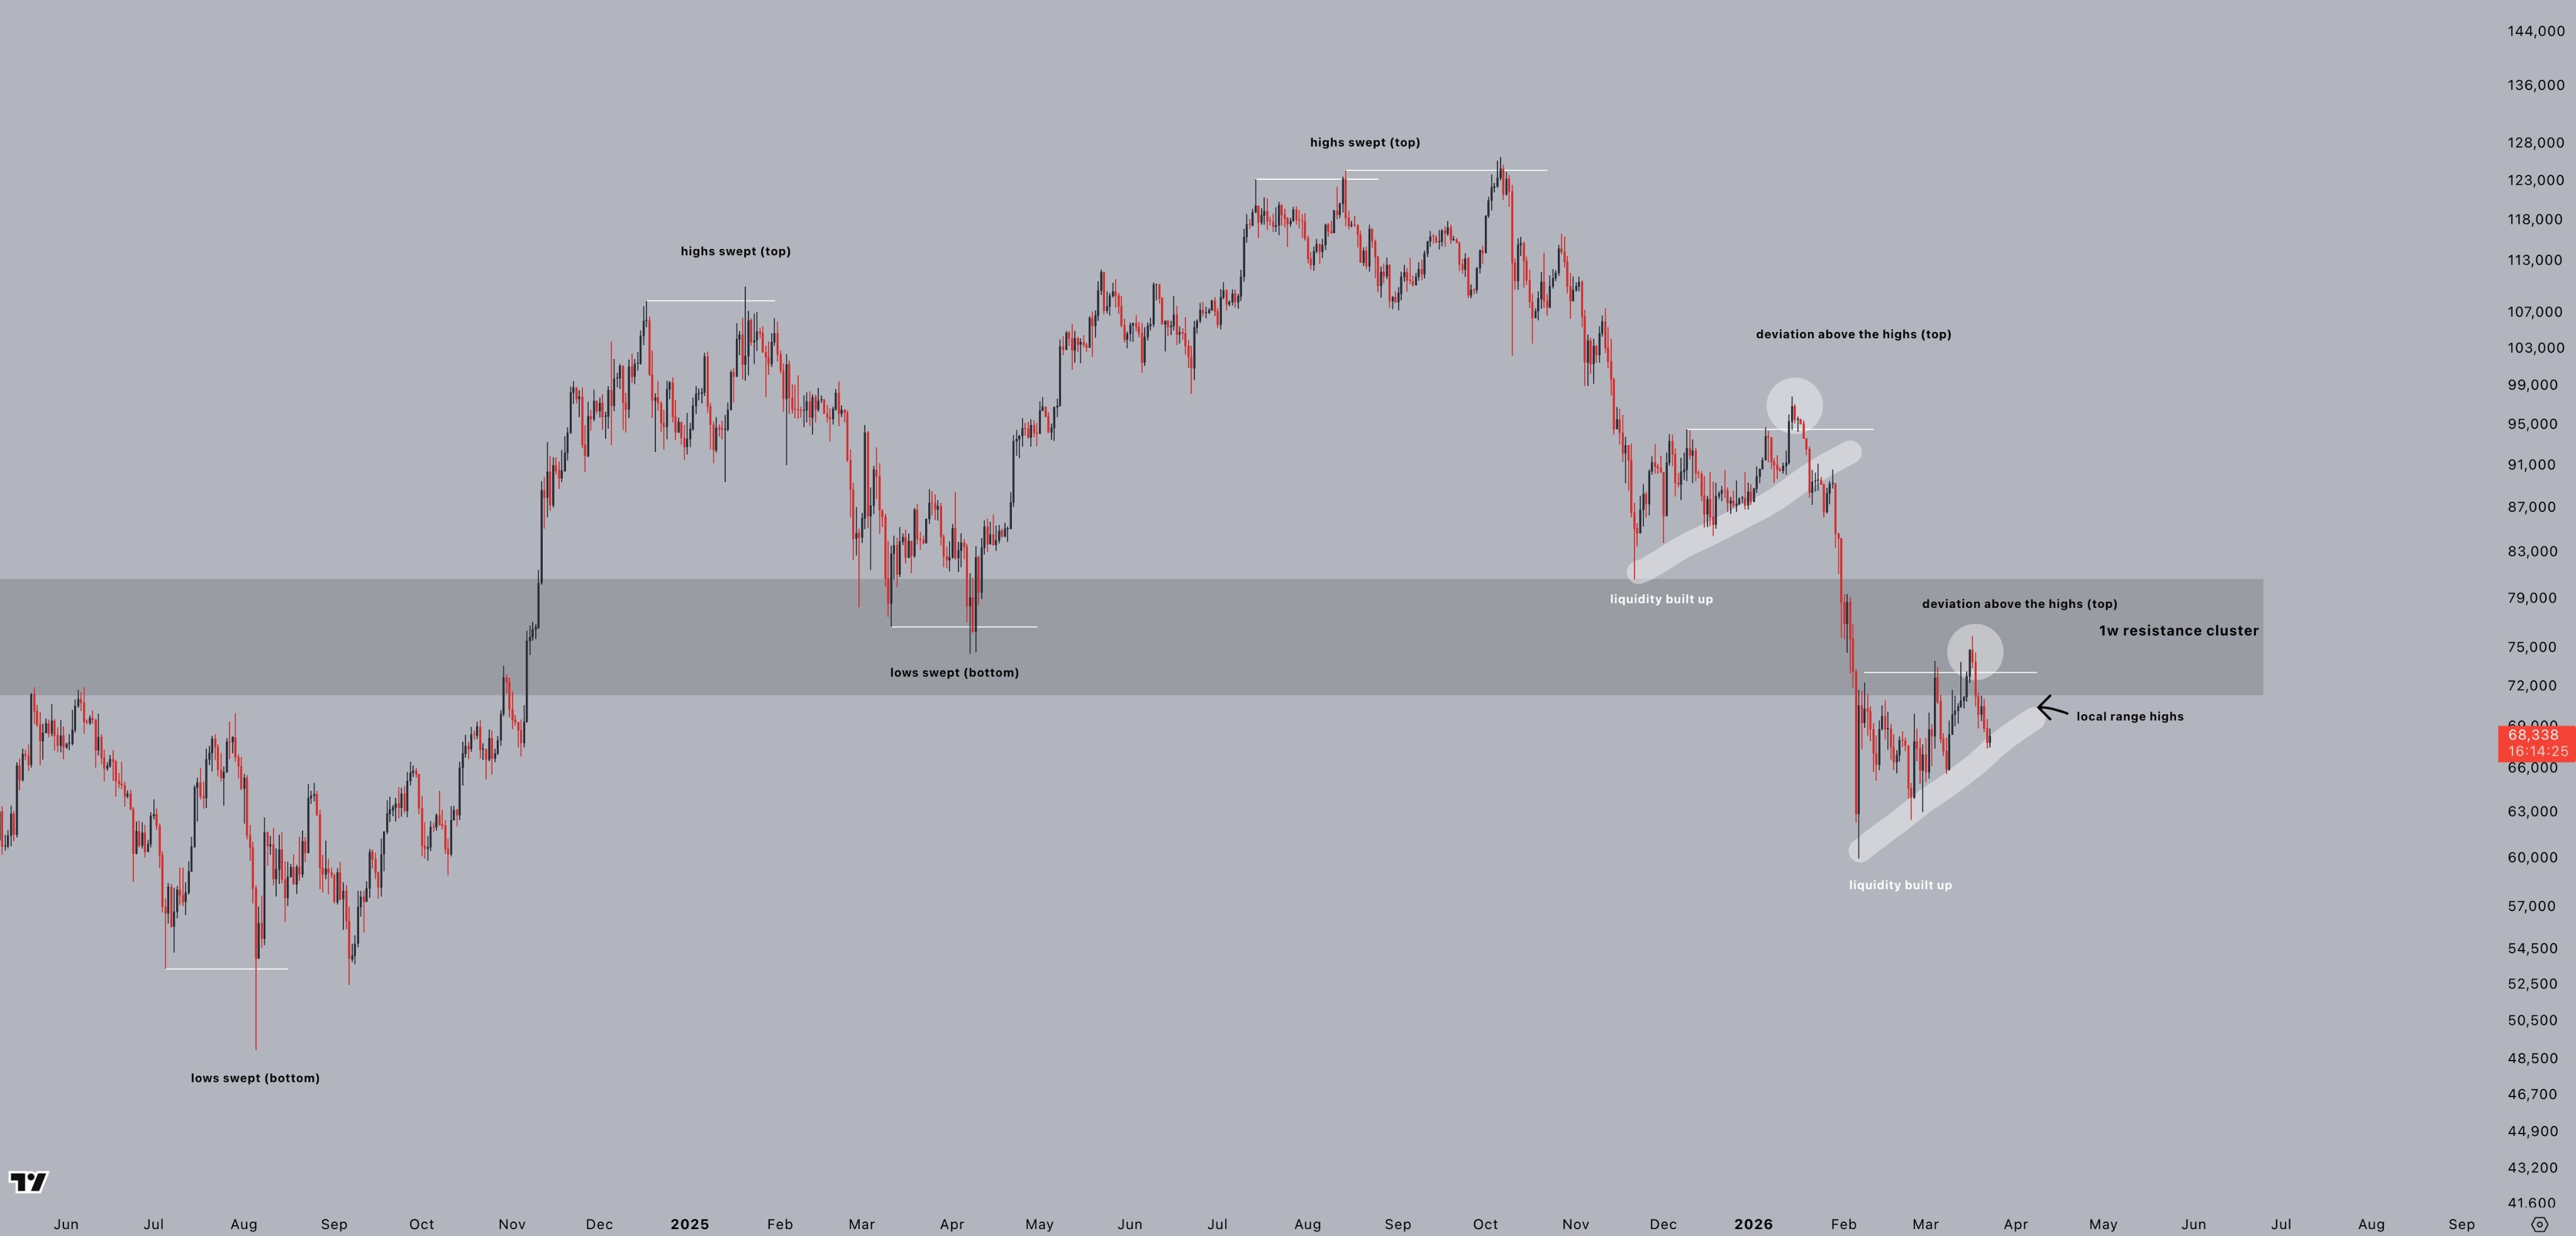
BTC price trends closed below a key trend line on a weekly basis, and traders generally believe that the bullish sentiment at the beginning of this week will only bring a brief rebound.
Prices increasingly show signs of a 'bearish flag' re-emergence from January, with the current target pointing to a new multi-year low.
Gold has entered a technically bearish zone as the situation in Iran remains tense, with oil prices returning to $100.
The market is beginning to consider the possibility of a Federal Reserve rate hike in 2026, but history may still bring a glimmer of hope for risk assets.
Since March, long-term Bitcoin holders have been selling at a loss.
Bitcoin's weekly closing has fallen below the 200-week trend line.
After a tough weekend, Bitcoin still struggles to regain support as traditional financial traders return to the market to start a new week.
TradingView data shows that the price fell to around $67,400 at the weekly close, losing control of the key 200-week Exponential Moving Average (EMA) trend line.
Previous analysis indicated that closing above the 200-week EMA at $68,300 is considered crucial for the bullish side's protection in the future.
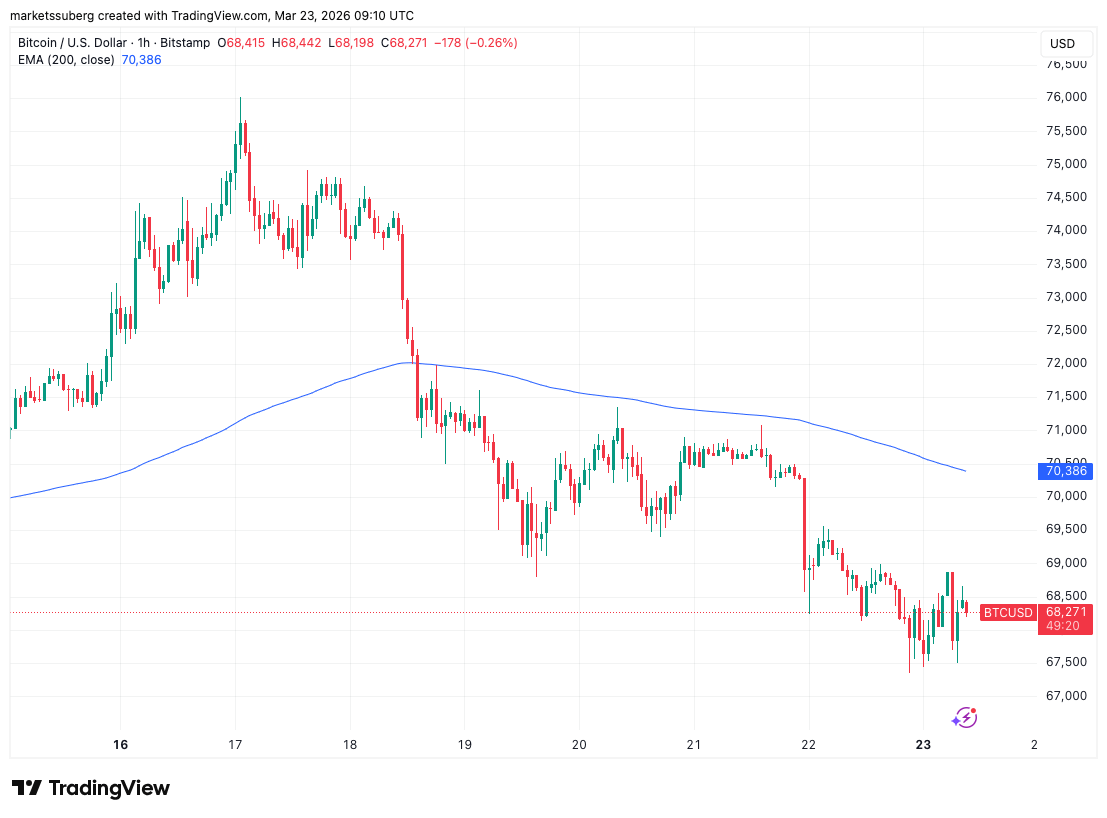 BTC/USD one-hour chart, including 200-week EMA. Source: Cointelegraph/TradingView
In the latest analysis released on Sunday on the X platform, trader CrypNuevo predicted that the market remains dominated by geopolitical factors.
'It feels like we will also be stuck in this range next month.'
'If certain conflicts escalate next week (uncertainty), we may see prices test the lows again, as the long lower shadow on the 4-hour chart remains there.'
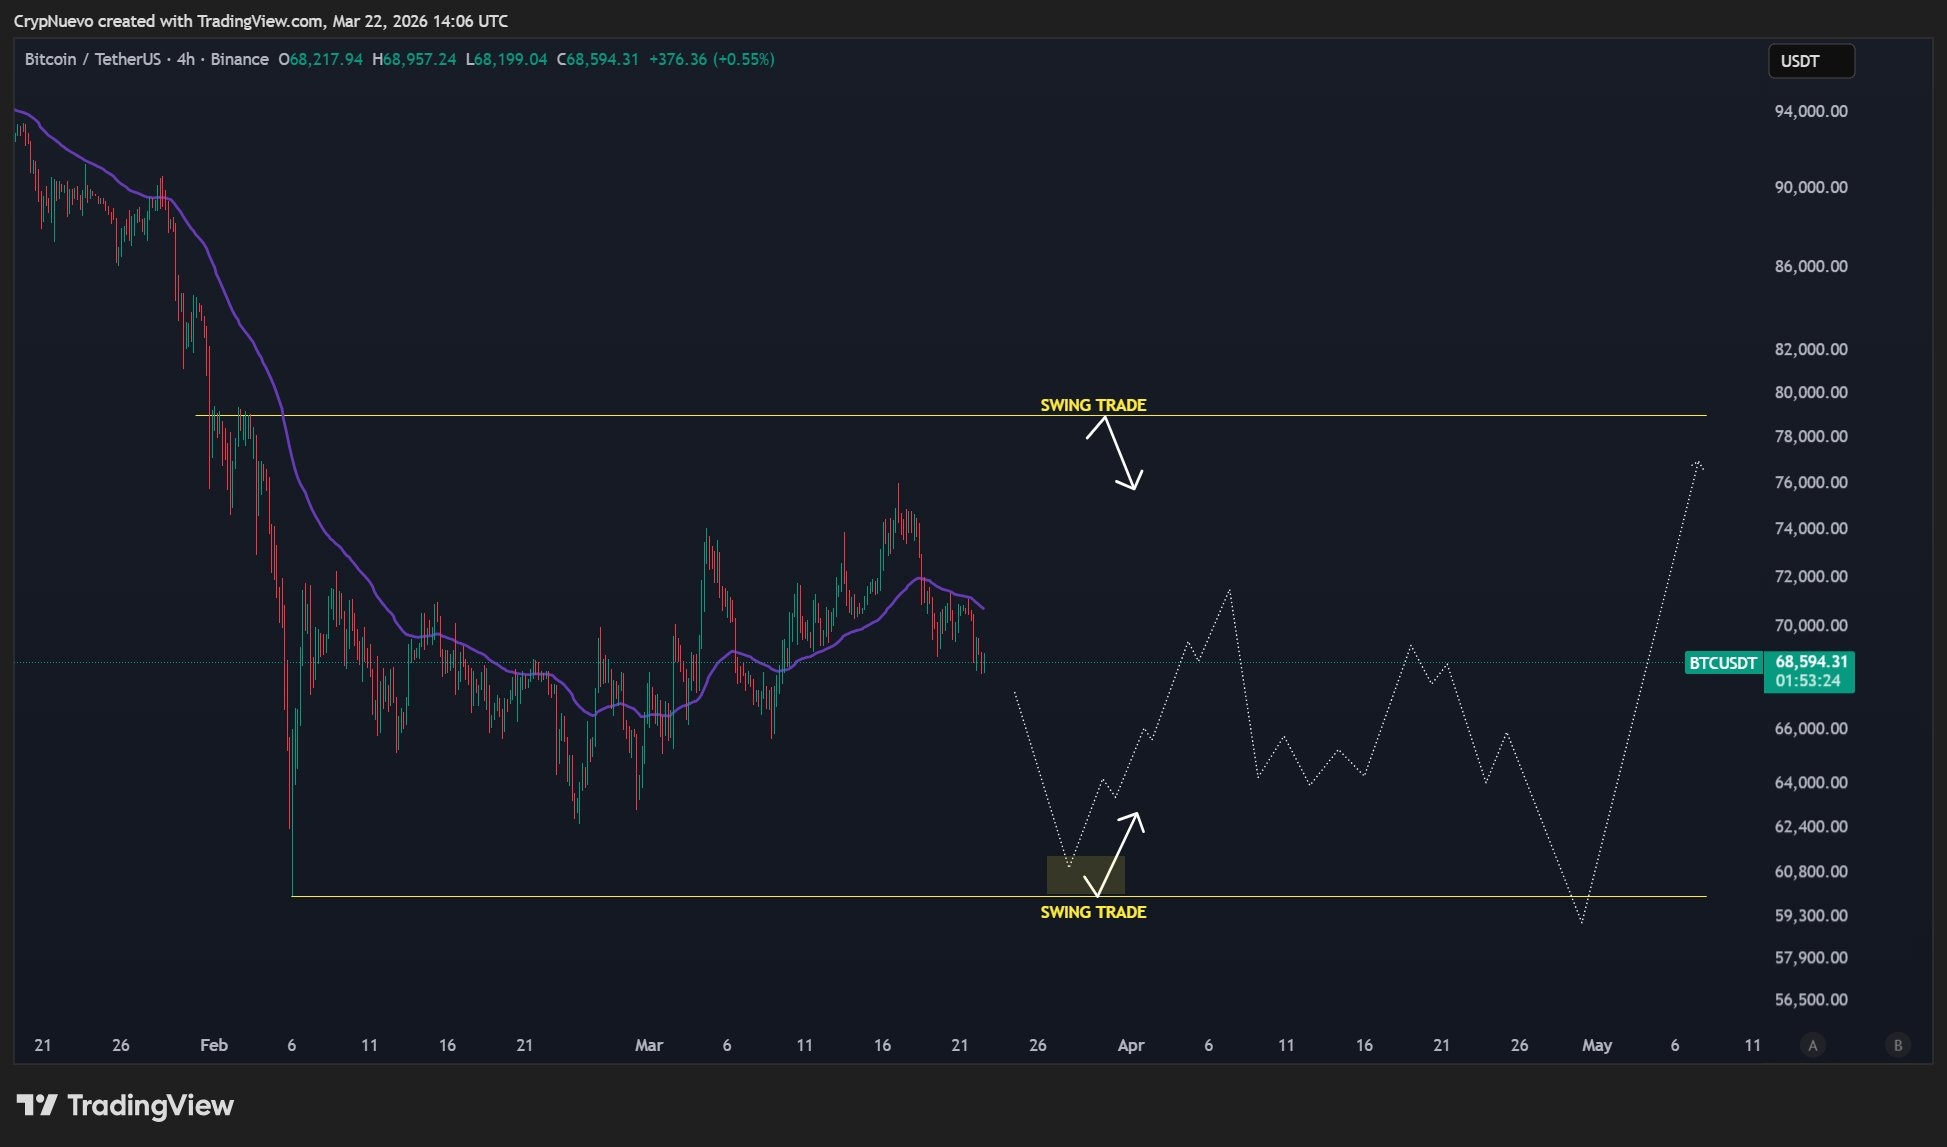 BTC/USDT four-hour chart. Source: CrypNuevo/X
CrypNuevo mentioned that Bitcoin fell below the $60,000 mark in early February.
'Regarding the LTF, I lean towards the possibility of a price reversal to $65,000 next week,' he added.
'If there is a brief spike early this week, I want to set up near $70,000, but I need to be cautious because if acceptance exceeds $71,000, this strategy will fail, and I will look bullish towards $73,000-$74,000.'
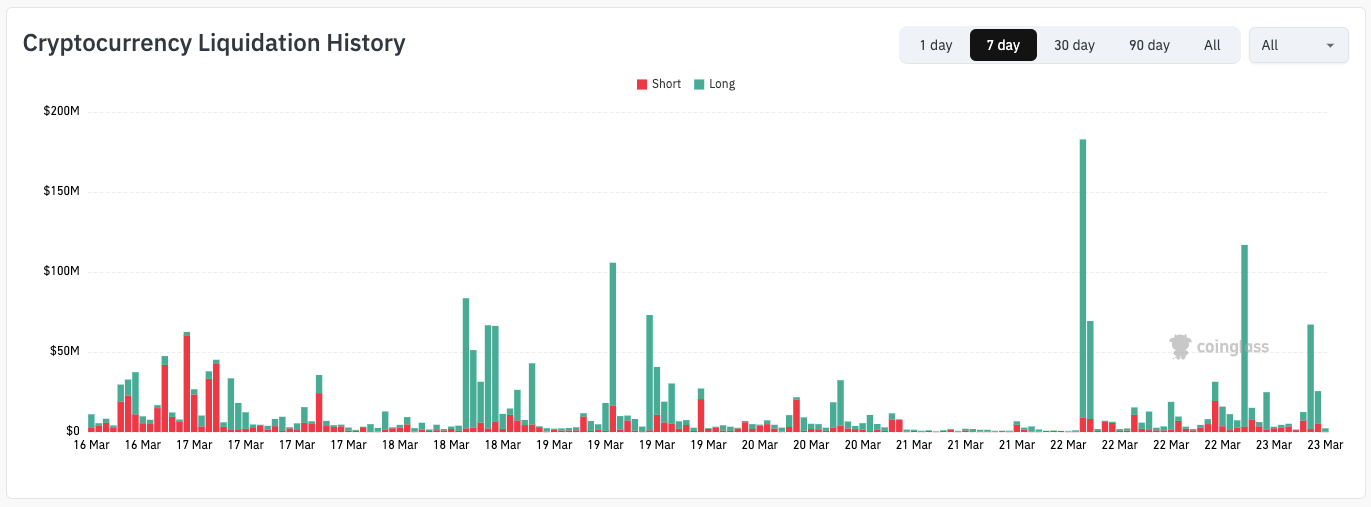 History of cryptocurrency liquidations (screenshot). Source: CoinGlass
According to CoinGlass data, as of Monday, over $400 million in liquidations occurred within 24 hours.
Due to the accumulation of liquidity above, trader Castillo Trading has noted the potential for a short squeeze.
On the other hand, on-chain analysis platform CryptoQuant commented on the latest price movements, suggesting that weekend volatility is normal.
'Weekend institutional participation significantly decreased, and spot demand—especially ETF flows—virtually halted, causing the market to rely more on derivatives positions and short-term liquidity conditions,' XWIN Research Japan wrote in a blog.
'The lack of liquidity has also exacerbated price sensitivity. After the order book thinned, smaller sell orders could lead to significant price fluctuations, often triggering chain reactions like stop-losses or liquidation events.'
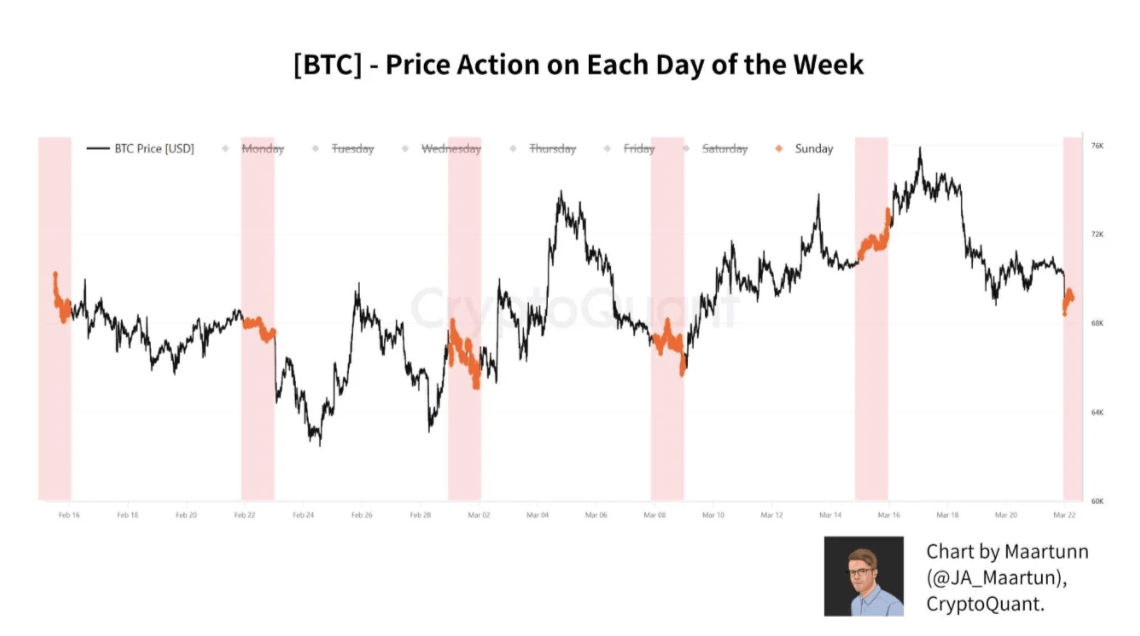 Bitcoin's price movement on Sunday (screenshot). Source: CryptoQuant
XWIN emphasizes that weekend price movements 'cannot serve as signals for trend continuation or reversal.'
Traders are paying attention to the reappearance of a January bearish flag.
For Bitcoin bulls, history may repeat itself this week—as before, bearish sentiment is dominant.
The focus of market concerns is another bearish flag pattern on the daily chart.
Here, a warming period appeared in a macro downtrend, leading some investors to mistakenly believe in a trend reversal, and subsequently, the price broke below the lower edge of the flag, continuing the downward trend to set new lows.
As reported by Cointelegraph, traders have long warned about the impacts following the completion of a secondary bearish flag pattern.
'Almost identical. The bearish flag broke down and tested, with low volume during the rise,' trader Roman stated on the X platform after BTC/USD hit a six-week high of $76,000 last week.
After the weekend, trader Jelle believes that the support level has been breached.
'If you are a bull, this is not a good start. Here, the consolidation for a day or two, the untested lower low is very likely to be breached,' he warned on the X platform.
 BTC/USD chart. Source: Jelle/X
On Saturday, Material Indicators co-founder Keith Alan stated that the target for the breakdown of the bearish flag pattern could be below $50,000.
Concerns about Iranian oil prices, gold enters a bearish market.
The global energy crisis in the Middle East has brought new shocks to risk assets and safe-haven products this week.
Asian stock markets fell sharply in the first trading session, and gold and silver also faced downward pressure. Bitcoin fell in sync, dropping to a two-week low at the weekly close on Sunday.
Trading resource The Kobeissi Letter commented that the decline in gold may lead to large participants in the market being liquidated.
'The intermittent fluctuations in price indicate that a large holder in this field is facing liquidation,' it stated on the X platform.
Kobeissi added that the rise in U.S. 10-year Treasury yields 'is starting to weigh on the performance of various assets.'
'Overlaying headline fatigue and the market liquidity 'pocket' effect, the bidirectional volatility range is expanding increasingly,' he added.
'Significant events are now happening in the precious metals market.'
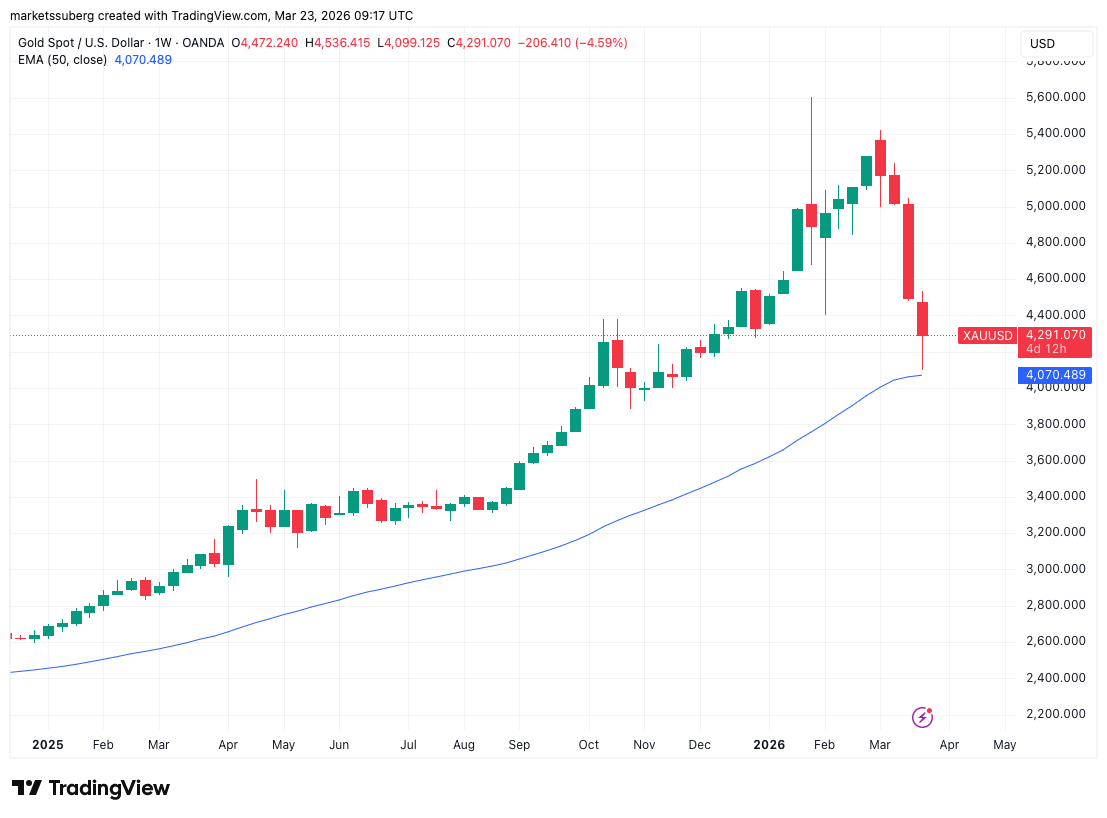 XAU/USD weekly chart, including 50EMA. Source: Cointelegraph/TradingView
Since its historical peak, XAU/USD has cumulatively fallen over 20%, officially entering a bearish market, with an intraday low of $4,099 per ounce, marking a new low since November 2025.
Meanwhile, oil prices are striving to hold steady at the $100 mark, while uncertainties in the Strait of Hormuz persist.
In the latest issue of the regular newsletter 'The Market Mosaic', trading resource Mosaic Asset Company emphasized its impact on future U.S. inflation data.
'Oil prices are highly correlated with headline inflation; a $10 increase in the price of oil can push inflation up by 0.20% or more. Moreover, before the outbreak of conflicts in the Middle East, there were already signs indicating a resurgence in inflation,' the report stated.
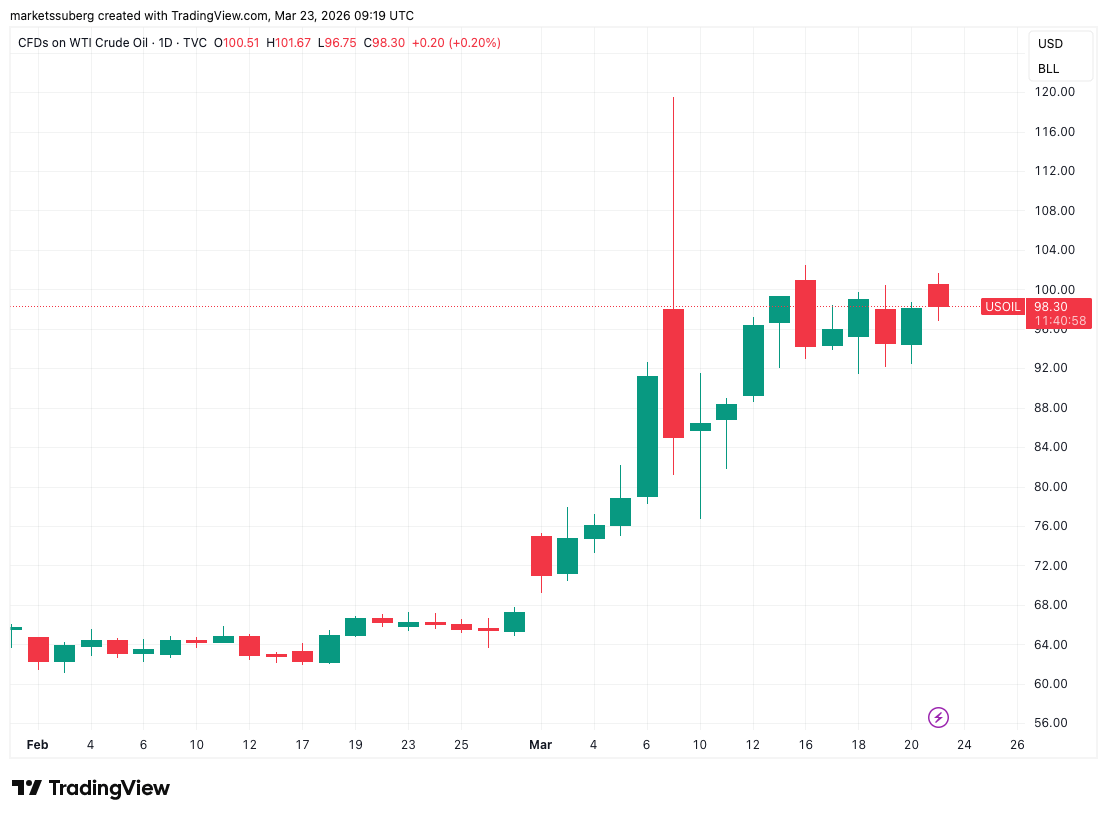 WTI crude oil spread contract daily chart. Source: Cointelegraph/TradingView
The Fed remains hawkish, but there is still hope for risk assets.
This week, important inflation data is scarce, with unemployment claims and S&P flashing Purchasing Managers Index (PMI) data becoming the market's focus.
The crypto market has recently been highly sensitive to PMI releases, while U.S. manufacturing has begun to recover after years of contraction.
Meanwhile, the resistance brought by the Iran war is intensifying, and last week the Federal Reserve's hawkish signals reflected in the last monetary policy meeting.
After the interest rates remained unchanged, Chair Powell pointed out that whether to loosen policy now depends on the 'progress made' on inflation.
'Therefore, the market is quickly repricing rate cut expectations,' Mosaic Asset Company commented.
'Although the market's implied probability does not yet predict a rate hike within a year, another key indicator suggests that a rate hike may be on the agenda.'
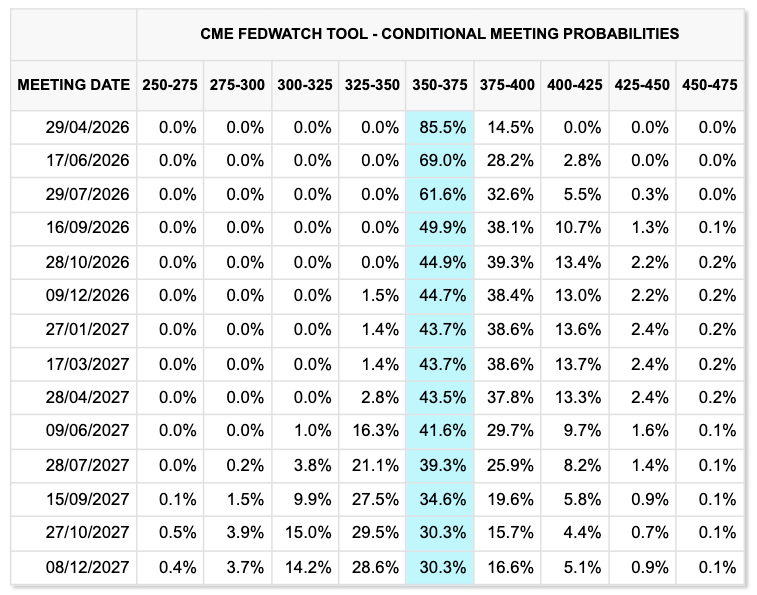 Federal Reserve target interest rate probability (screenshot). Source: CME Group FedWatch Tool
Despite the weakening of the U.S. labor market, a situation that traditionally prompts policy easing, the Fed's stance remains conservative.
And historical patterns may bring a glimmer of hope for risk assets. As reported by Cointelegraph, the correlation between crypto assets and U.S. stocks has recently strengthened.
'Market breadth and sentiment are brewing a rebound for the S&P 500. Meanwhile, significant geopolitical events suggest that historical experience may indicate a possibility of recovery for U.S. stocks,' Mosaic added.
Kobeissi also shares a similar view, stating that stock trading 'surged', with a massive expiration of options releasing a lot of capital last week.
'Friday's trading volume was also affected by the expiration of about $5.7 trillion in U.S. stocks, indices, and ETF options, marking the largest 'triple witching day' in at least 30 years,' it noted on the X platform.
'The massive expiration of options released billions of dollars, which may drive increased market volatility this week. Be prepared for fluctuations.'
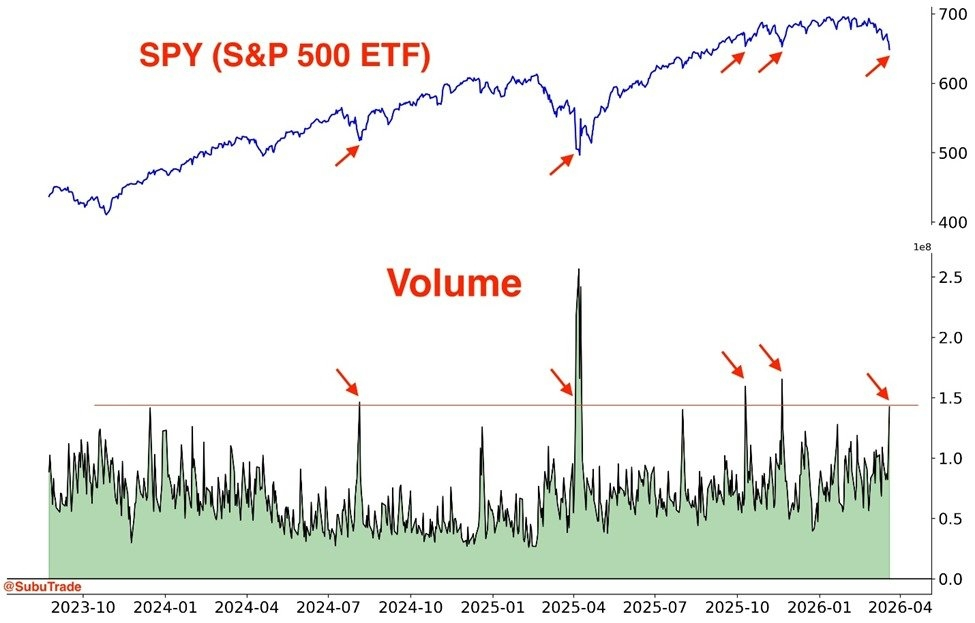 S&P 500 ETF chart and volume data. Source: The Kobeissi Letter/X
Bitcoin long-term holders sell at a loss.
Long-term holders of Bitcoin (LTH) are under pressure in the current price range—even if it hasn't fallen back to the bottom of that range.
CryptoQuant research shows that the Spending Output Profit Ratio (SOPR indicator) has issued a 'surrender' signal. This indicator measures the relationship between the cost price of transferring Bitcoin on-chain and the price at which it was previously transferred.
A SOPR below 1 means that the observed sample—in this case, long-term holders—are overall at a loss during transfers.
'On March 11, the SOPR for long-term holders of Bitcoin fell to 0.64, indicating that long-term holders sold at a loss of 36% compared to their cost price. This is one of the most extreme LTH surrender signals in recent months,' commented writer The Enigma Trader.
'This value is far below 1.0, indicating that even patient and faithful holders are being washed out, and real panic is emerging in the market.'
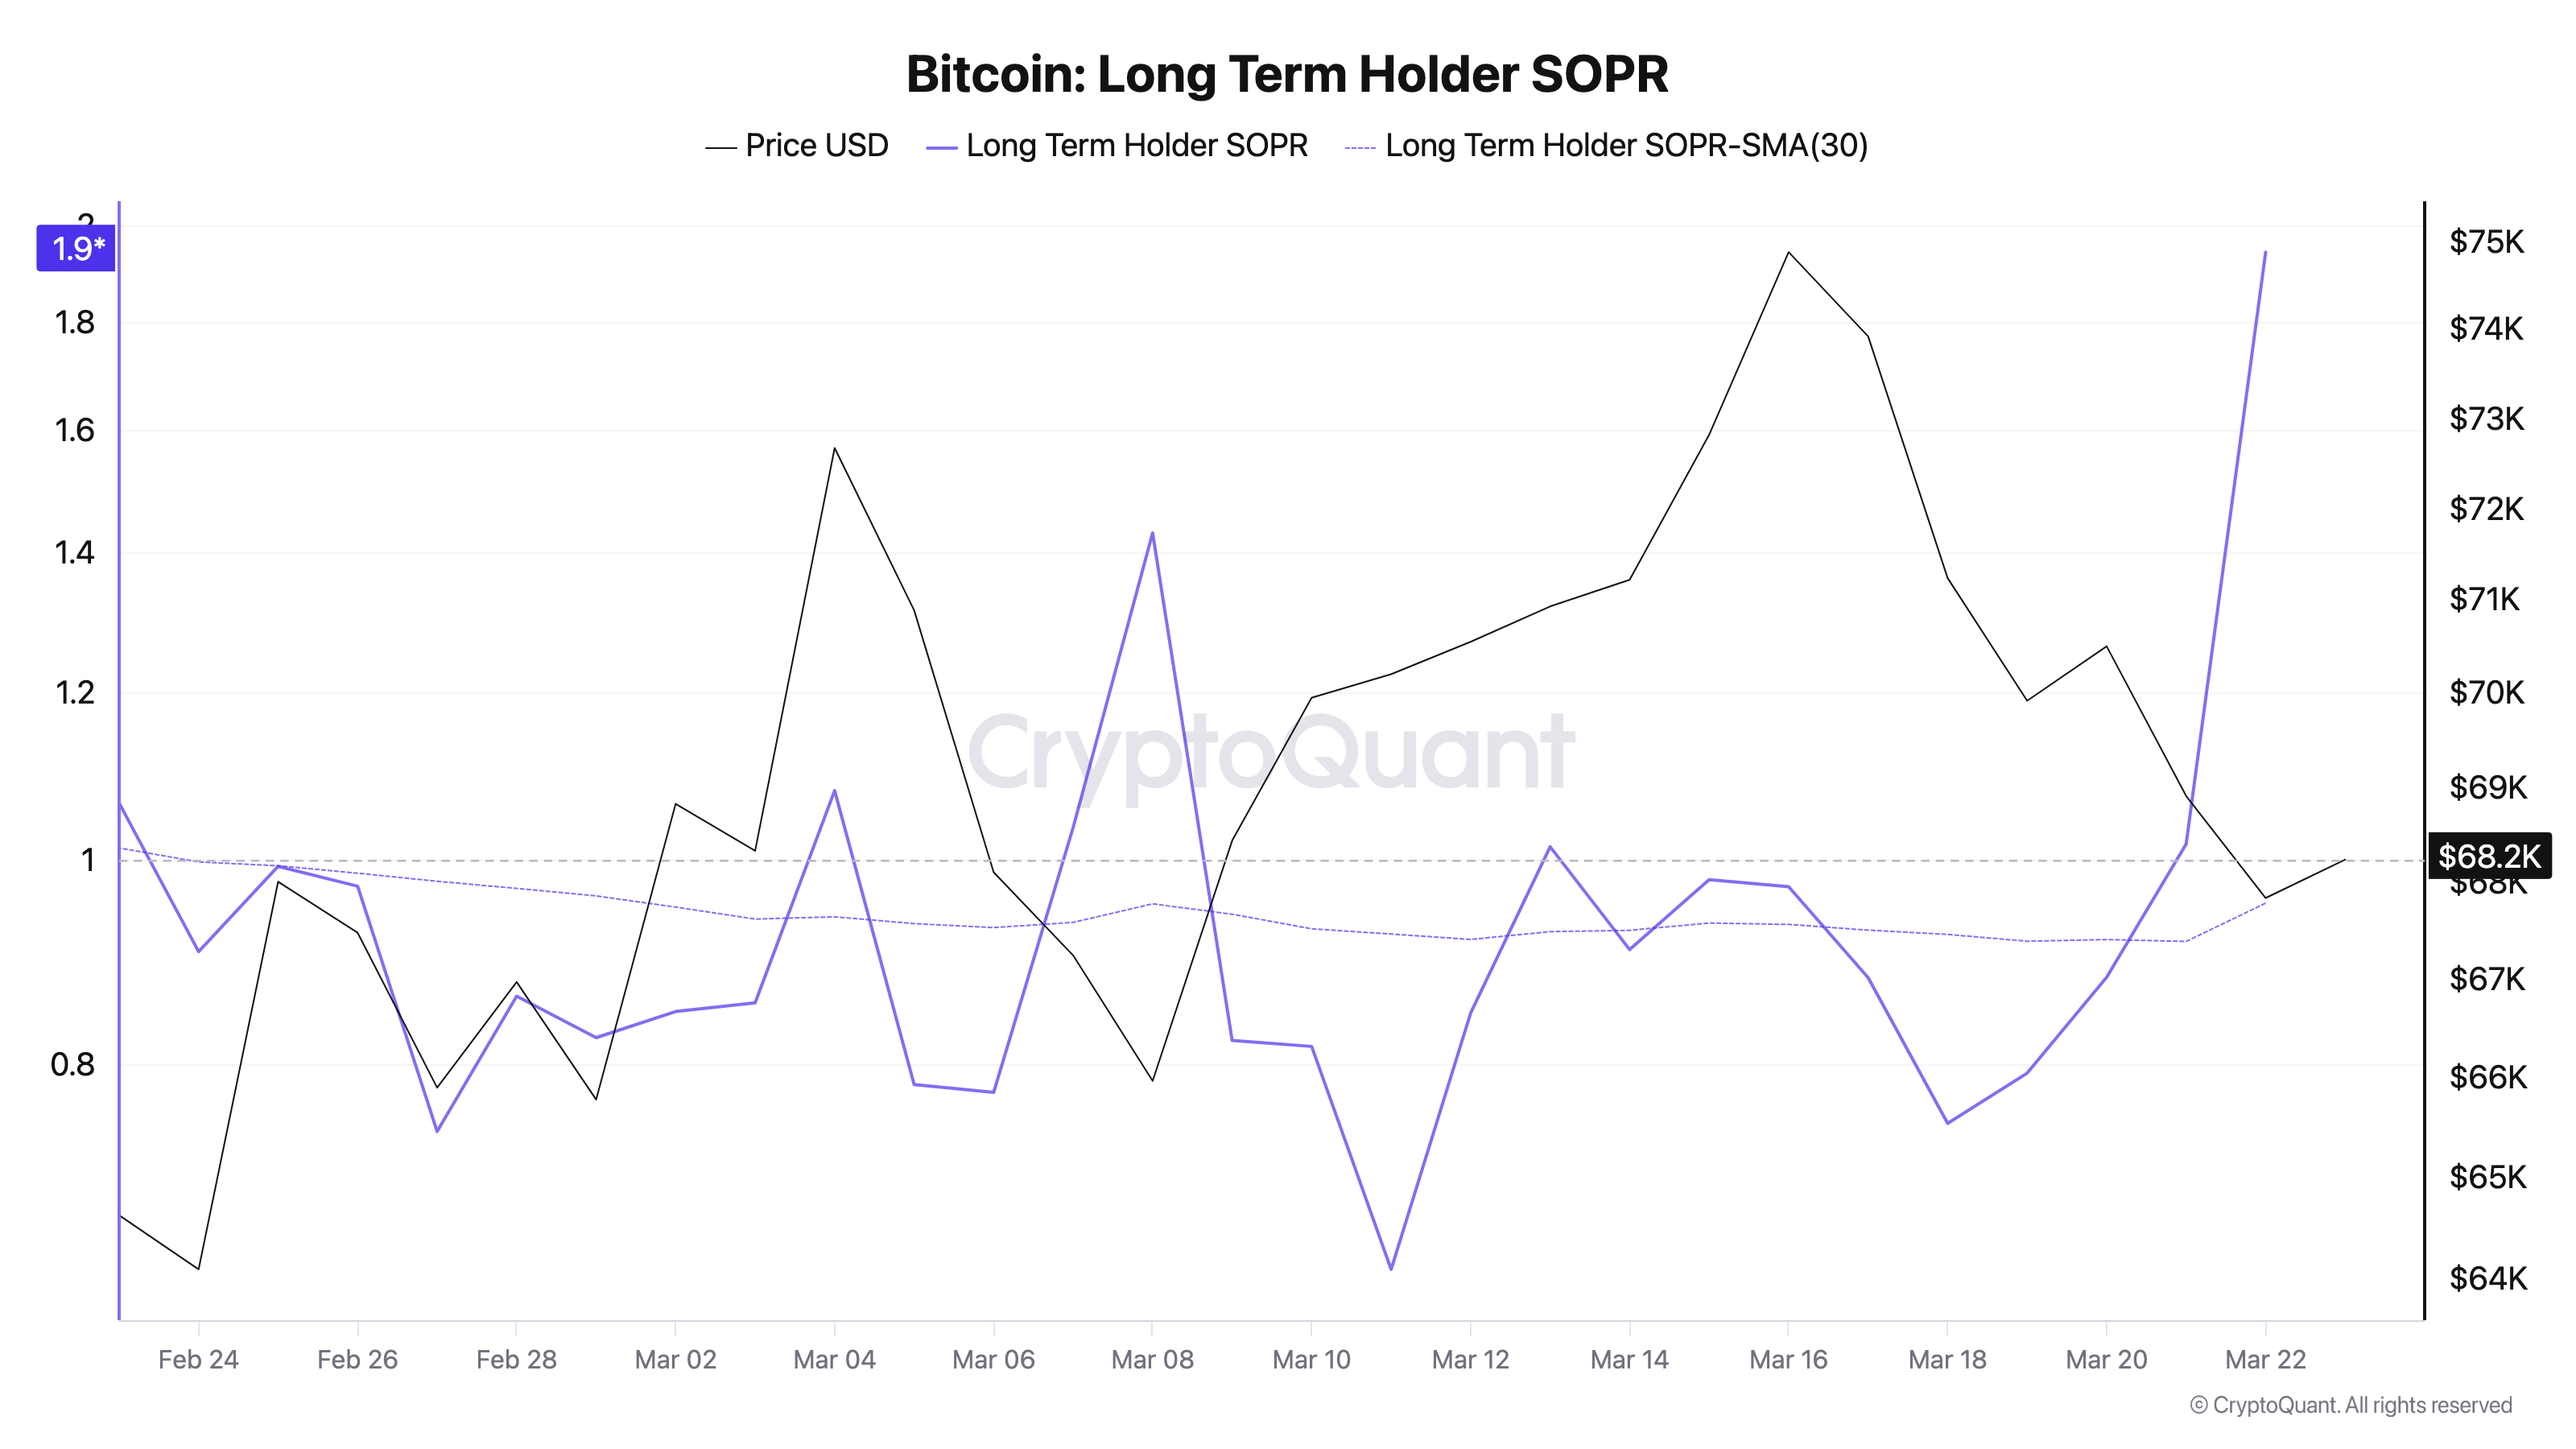 Bitcoin LTH-SOPR indicator and 30-day moving average. Source: CryptoQuant
The 30-day moving average of LTH-SOPR remains below 1—even though a large number of Bitcoins have been transferred out of exchanges, it may indicate the initial emergence of a new aggregation trend.
'One possible interpretation is that between March 10 and 20, when long-term holders surrendered, another group of investors was quietly accumulating chips and transferring them out of exchanges,' the article continued.
'Divergence and aggregation occur simultaneously, a typical phase transition characteristic.'