📊 $XLM
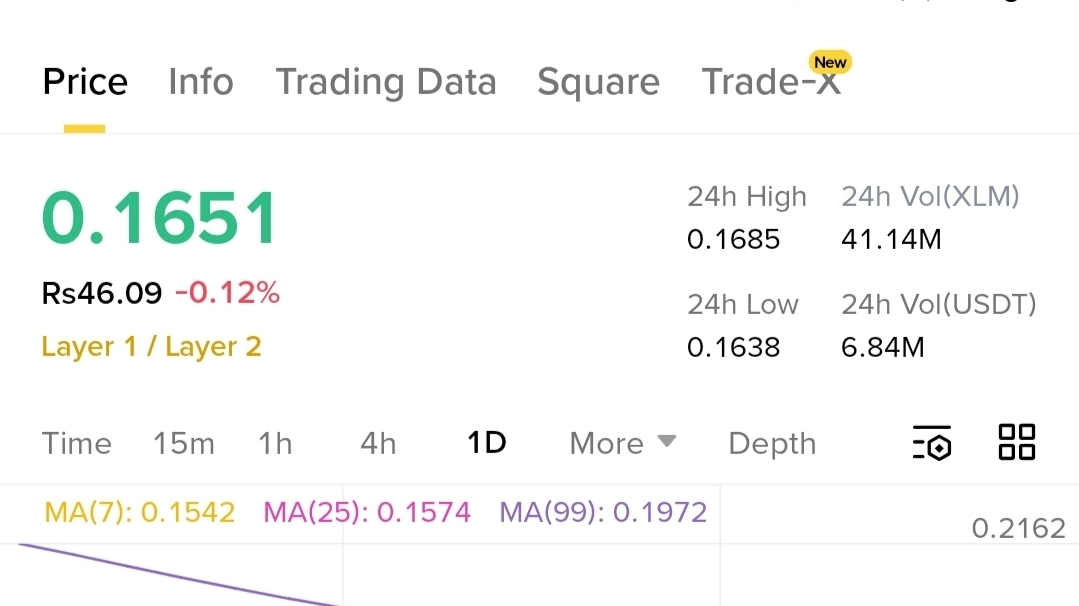
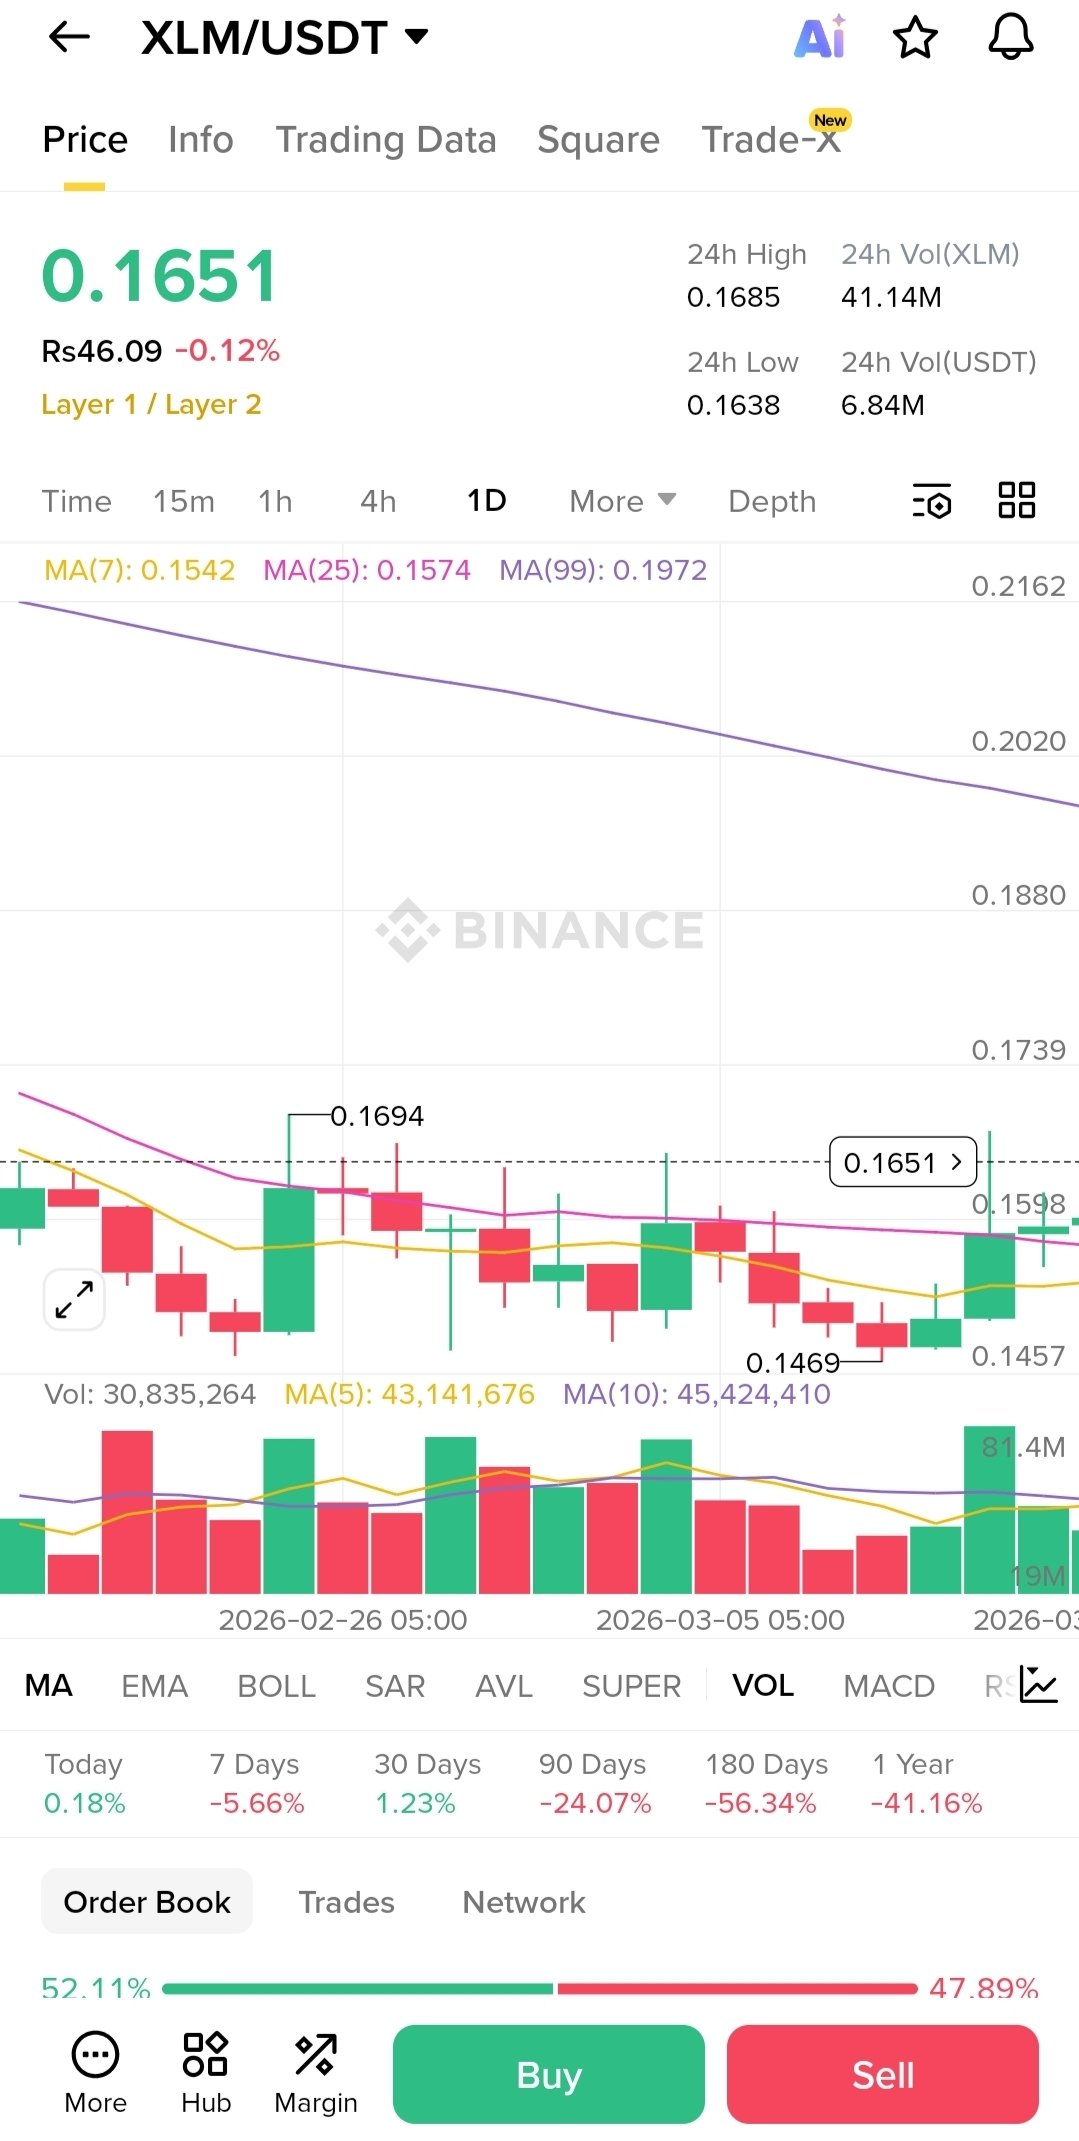
The chart for Stellar (XLM) on Binance is showing a classic consolidation phase, hinting that the market may be preparing for a decisive move. Currently trading around $0.1651, XLM is hovering near a key short-term resistance zone while maintaining stability after recent volatility.
🔍 Market Structure & Trend
On the daily (1D) timeframe, XLM remains in a broader downtrend, as clearly indicated by the MA(99) sitting above price around the $0.19 region. This long-term moving average continues to act as a dynamic resistance, confirming that bulls have not yet fully regained control.
However, there are early signs of trend stabilization:
MA(7): 0.1542 → Price is above this, indicating short-term bullish momentum
MA(25): 0.1574 → Acting as immediate support
Price is attempting to reclaim mid-range levels after bouncing from $0.1469 support
This suggests a potential accumulation zone, where smart money may be positioning ahead of a breakout.
📈 Key Levels to Watch
🔹 Resistance Zones:
$0.1690 – $0.1700 → Immediate resistance (recent rejection area)
$0.1800 – $0.2000 → Major supply zone aligned with MA(99)
🔹 Support Zones:
$0.1550 – $0.1570 → Strong short-term support (aligned with MA25)
$0.1469 → Critical swing low (loss of this = bearish continuation)
📊 Volume & Momentum Insight
Volume data shows increasing activity, especially with the latest green candles. This is a key signal:
Rising volume during upward moves = bullish interest building
If volume continues increasing, breakout probability rises significantly
However, the market still lacks explosive volume, meaning this is not yet a confirmed breakout—just a buildup phase.
⚖️ Bullish vs Bearish Scenario
🟢 Bullish Case:
If XLM breaks and holds above $0.1700, we could see:
Momentum push toward $0.1800+
Possible trend reversal attempt
Short-term traders entering aggressively
🔴 Bearish Case:
If price fails and drops below $0.1550:
Retest of $0.1469 support
Breakdown could trigger further downside toward $0.1400
🧠 Market Sentiment
Order book data shows a slight buyer dominance (52% vs 48%), indicating mild bullish sentiment. But this is not strong enough yet to confirm a rally—it’s more of a neutral-to-bullish bias.
🚀 Final Thoughts
XLM is currently in a compression phase, where volatility is decreasing and price is tightening. These setups often lead to sharp breakout moves.
👉 Traders should watch for:
Volume spikes
Clean breakout above resistance
Strong candle closes
This is not the moment to chase—but rather to prepare for confirmation.
🔥 Conclusion
Stellar (XLM) is quietly building momentum. Whether it breaks up or down, one thing is clear:
A big move is coming — the only question is direction.

#XLM #Stellar #XLMSPOT CryptoTrading #AltcoinAnalysis #CryptoSignals 🚀