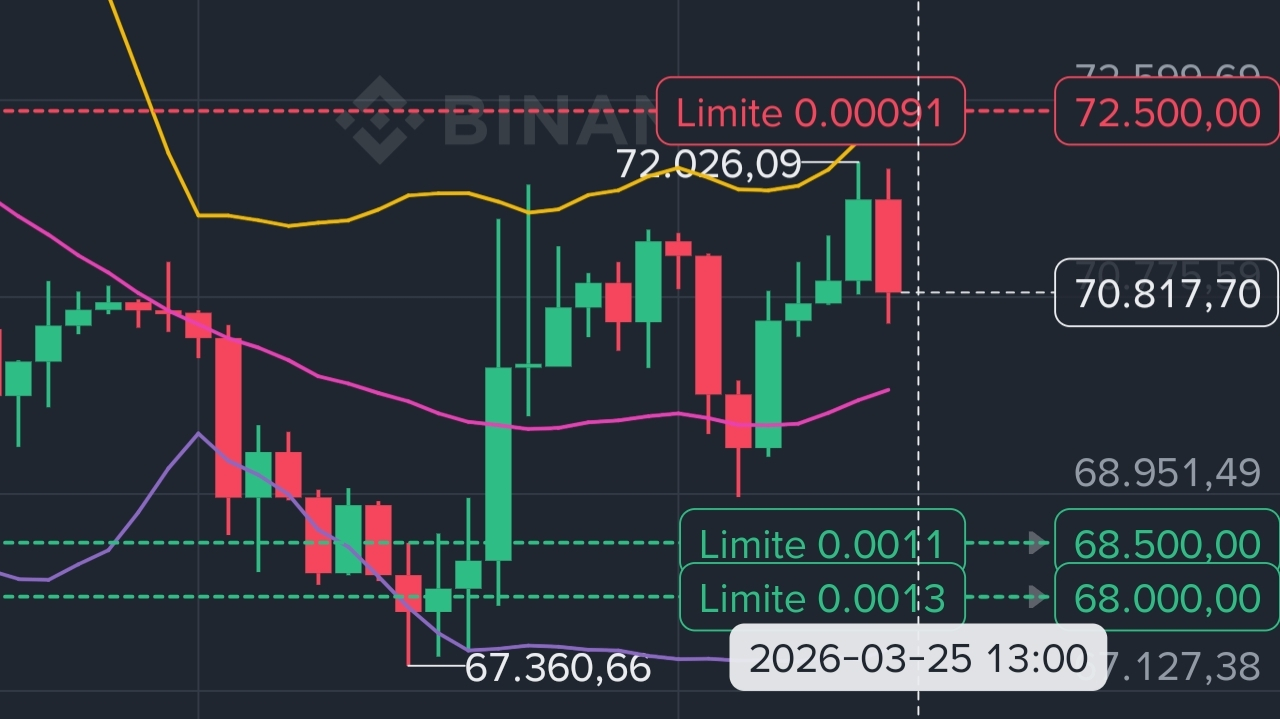
If you are looking at the BTC chart now (70.817 USD at the time of writing), you must be thinking the same as I am:
“Wow, the guy is moving very slowly… almost stopping.”
This has a technical name: lateralization (or consolidation/range). It is when the price oscillates within a defined range, with no strength to rise or fall sharply. In the current case, BTC has been stuck between 68,900 and 72,000 USD for weeks. Low volume, small candles, tight Bollinger Bands… the classic “market boredom.”
1. What is sideways movement, after all?
Sideways movement is the period when buyers and sellers are in balance. No one dominates.
Price rises a bit → meets resistance and falls back.
Price drops a bit → finds support and rebounds.
In the 4h chart you sent, it's clearly visible:
Bollinger Bands (20,2) very narrow → low volatility.
Price orbiting the average (MA ~69.915).
William %R and Stochastic RSI showing rapid overbought/oversold, but with no clear trend.
It's the opposite of a strong bull run or bear market. It's the 'accumulation' or 'distribution' that large players do before deciding the next big move.
2. Why is BTC in sideways movement now (March/2026)?
Fear & Greed in Extreme Fear (index between 11 and 37) → market with a lot of fear, no FOMO to push up.
Volume declining → little liquidity for a clean breakout.
No strong catalyst → neutral macro news, no major event (FOMC has passed, halving has already occurred).
Liquidity hunted → large players sweeping stops above (72k) and below (68.5k–68k), exactly where your grid is set up.
Result: the price stays 'sideways', almost stopping. Many call it 'deadly boredom'. But for those with the right strategy, it's pure gold.
3. Advantages and disadvantages of sideways movement
Advantages (for those trading like you):
Perfect for a buying grid (you buy cheap on the dips and wait for the rebound).
Ideal for a staggered selling trap (you've set 72.5k, 76.5k, 78.5k, and 82.5k → partial profit without needing to hit the top).
Low risk of sudden liquidation (price doesn't move fast enough to catch you off guard).
Disadvantages:
Frustrating for those who want immediate action ('almost stopping' as you said).
Can last weeks or months (we've seen ranges of 2-3 months in 2025).
Many traders lose patience and exit at the worst moment.
4. How are you taking advantage of this (your current strategy)
Your position is perfectly aligned with this sideways movement:
Holding ~0.00483 BTC → free for upside.
Grid reinforced at 68.5k and 68k → ready to drip when the price sweeps liquidity below.
Selling trap in 4 steps (72.5k to 82.5k) → you realize profit gradually when it breaks.
Cash ~260 USDT earning → ammunition to buy cheaper.
As long as the price stays in this range, you don't need to do anything. The Crypto Saint is working for you: buying at support and selling at resistance automatically.
5. What to expect after this sideways movement?
Historically, every strong range ends with an explosive breakout (either up or down).
Most likely scenario (60-70%): Breakout above 72k → air pocket until 74k–78k (exactly where your trap is set).
Risk scenario: Loss of 68.2k with volume → deeper test (that's where your grid protects).
The secret is not to try to predict the exact day. Let life (and the Crypto Saint) work.
Ç#Investimento #SantoCripto #btcbrasil #TradingView #Altcoins