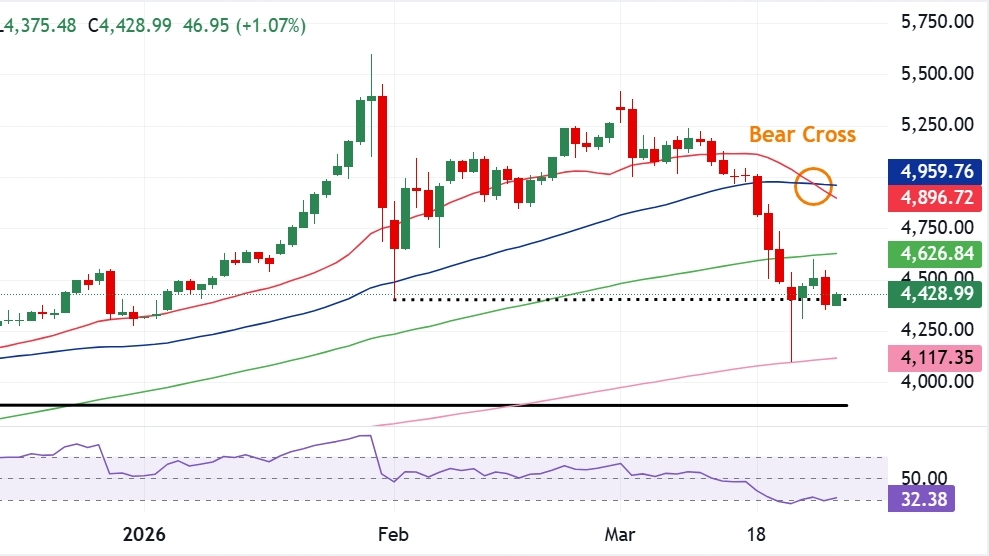
The short-term bias is slightly bearish as the price continues to decline below the 21-day and 50-day simple moving averages (SMA), with the faster average now turning down and the intermediate average flattening. This configuration indicates that sellers are taking control after a failed attempt to maintain the previous uptrend. The 100-day and 200-day SMAs continue to rise significantly below the current price, signaling that the broader trend remains bullish, but their distance from the current price highlights the depth of the ongoing correction. The relative strength index (RSI) at 32 is just above the oversold zone, indicating persistent bearish momentum with the potential for further declines before a more significant rebound occurs.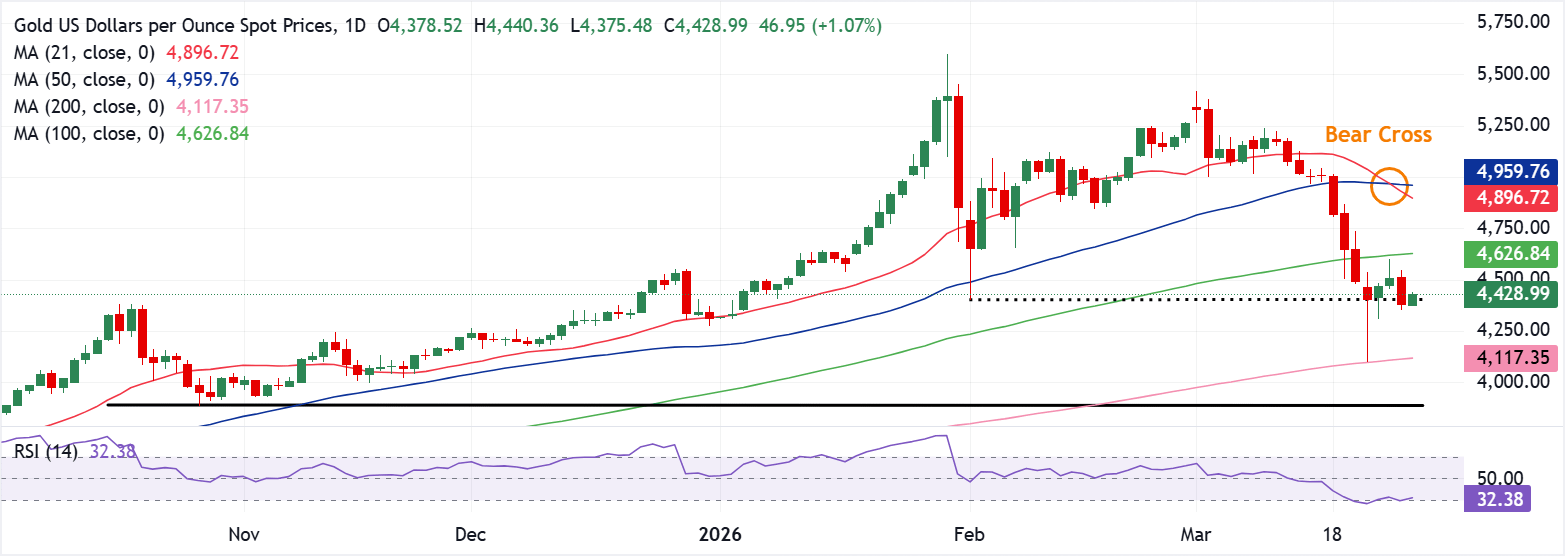
The first resistance is now observed near the 21-day SMA at around $4,900, where the recovery will initially face dynamic selling pressure, followed by the 50-day SMA around $4,960. To weaken the current bearish sentiment and open the path to the $5,100 area, a daily close above this last barrier will be required. From a downside perspective, the nearest support is forming at the recent lows around $4,400, and a break below this will open the way to the rising 100-day SMA around $4,630 as the next significant downside target. A sustained drop to this average will deepen the correction phase, while a failure to reach this level and a bounce from the $4,400 area will signal that buyers on dips are beginning to defend the long-term bullish structure.