
Traders stated that the price of ETH may have further declines after the bulls failed to defend the support at $2,000, with signs of weakening demand becoming evident.
 The drop of Ether ETHR$ 10,369 below $2,000 on Friday put the asset at risk of a deeper correction in the coming weeks or months.
Ether traders anticipate a deeper correction
Data from TradingView shows ETH/USD trading at $1,975, down 5% in the last 24 hours. This drop was accompanied by over $111 million in long position liquidations in ETH.
The pair failed to break the resistance at $2,200 earlier this week, while outflows from Ether spot ETFs, a drop in DEX volumes, and a reduction in the premium of ETH futures hampered Ether's recovery.
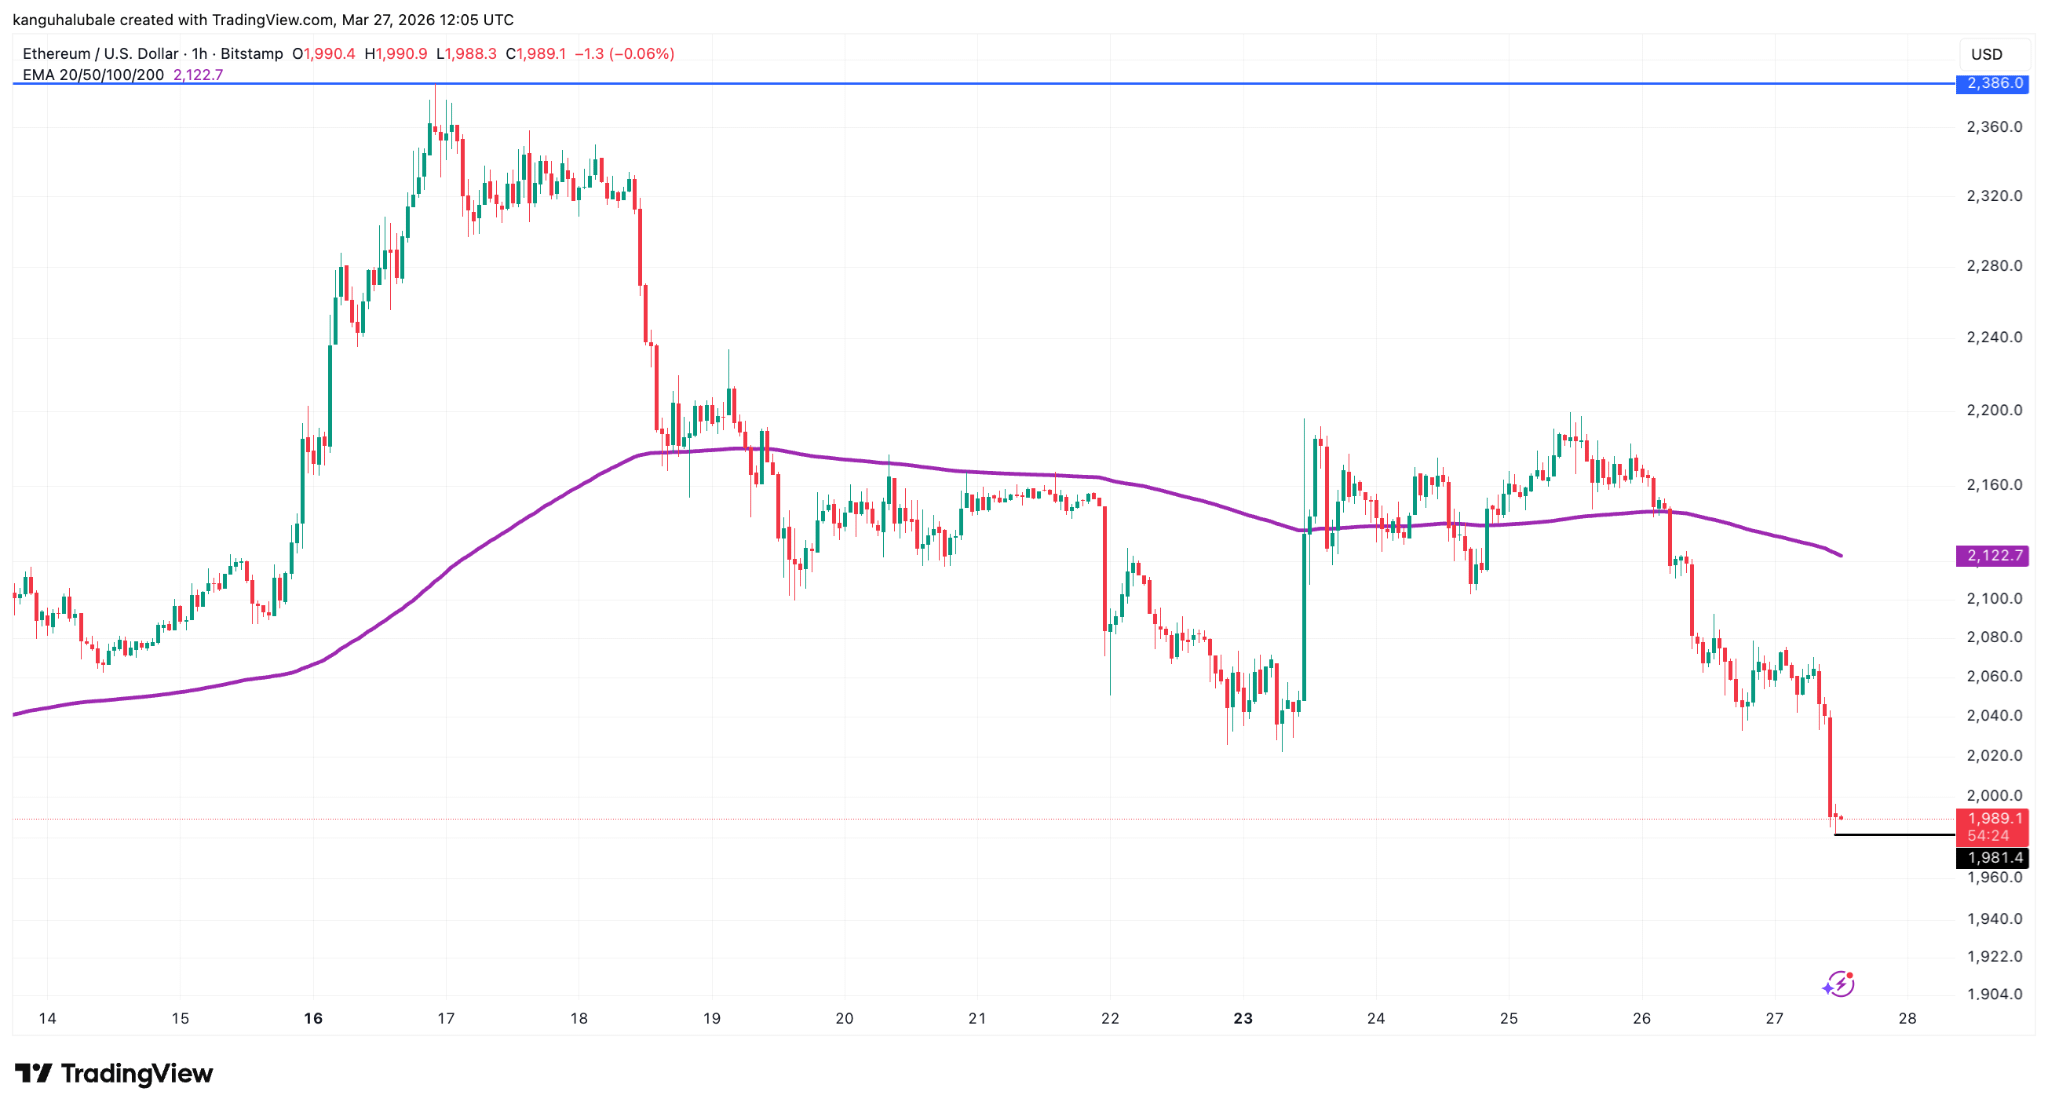 Hourly chart of ETH/USD. Source: Cointelegraph/TradingView
ETH continues to press the same resistance, but the issue is below the price action, said trader Onur in a post on X on Friday, adding:
'Even with strong narratives in the long term, short-term demand still seems weak.'
Analyst CryptoWZRD stated that ETH may have an 'additional drop' towards the support zone of $1,800 after the altcoin closed below $2,200 on Thursday.
'ETH fell below the $2,100 level,' said analyst and trader Ted Pillows in a post on X on Friday, adding:
'This is a sign of weakness and shows what’s next for ETH.'
A supplementary chart suggested that the price may first drop towards the support level of $1,800 before recovering.
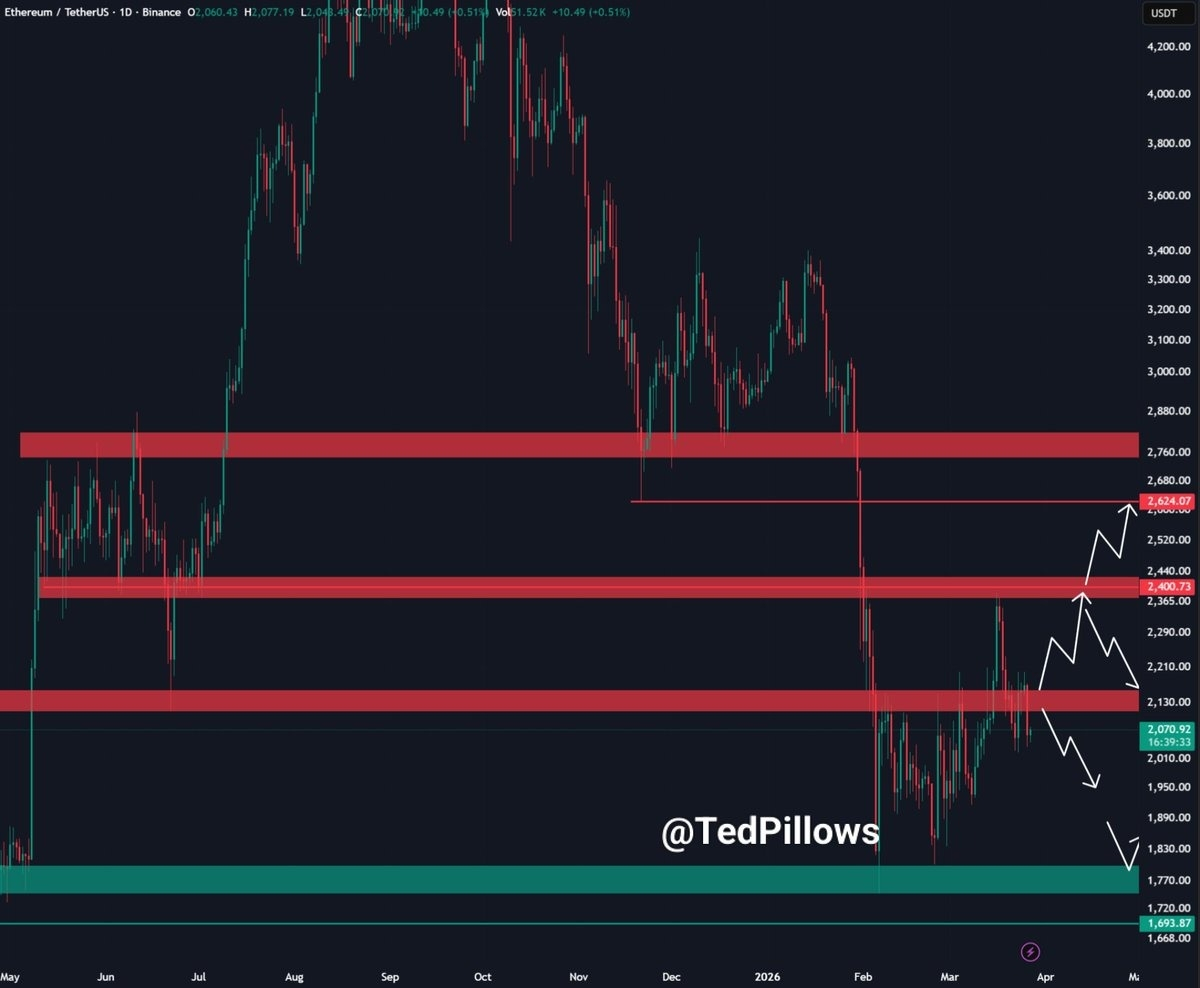 Daily chart of ETH/USD. Source: X/Ted Pillows
As reported by Cointelegraph, a close below the 50-day simple moving average at $2,000 could lead the ETH/USD pair to $1,900 and subsequently to the range between $1,850 and $1,750.
The apparent demand for Ether hits a 16-month low
The apparent demand for Ether has turned negative after falling to the lowest level since October 2024, as traders adopted a risk-reduction stance due to geopolitical uncertainty and macroeconomic headwinds.
The apparent demand indicator for Ethereum from Capriole Investments shows that demand for ETH has been negative since March 3, reaching about -58,000 ETH on March 16, marking 16-month lows. The indicator has since improved to -23,475 ETH at the time of writing.
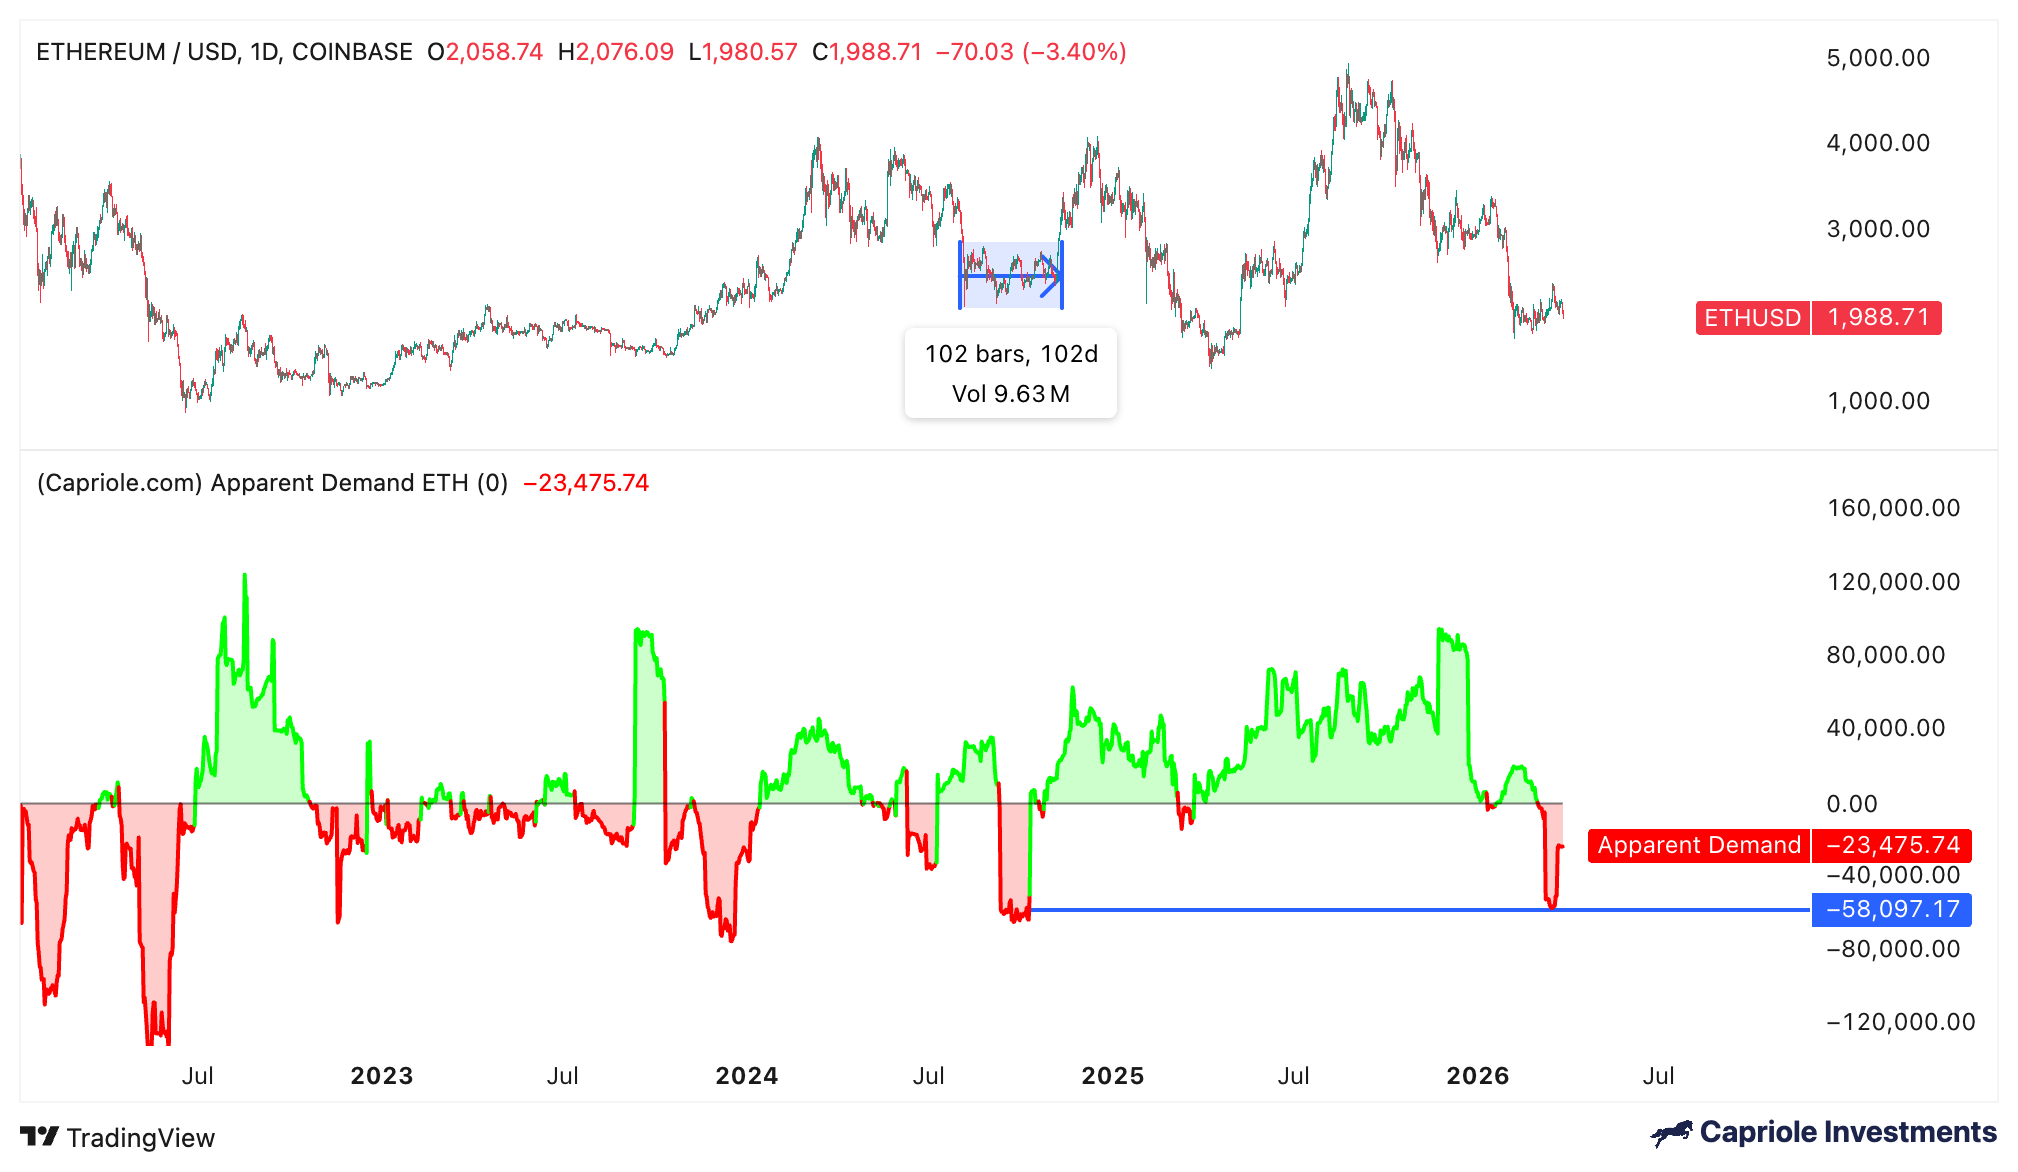 Apparent demand for ETH. Source: Capriole Investments
Meanwhile, spot ETH ETFs recorded net outflows for seven consecutive days, totaling $391.8 million.
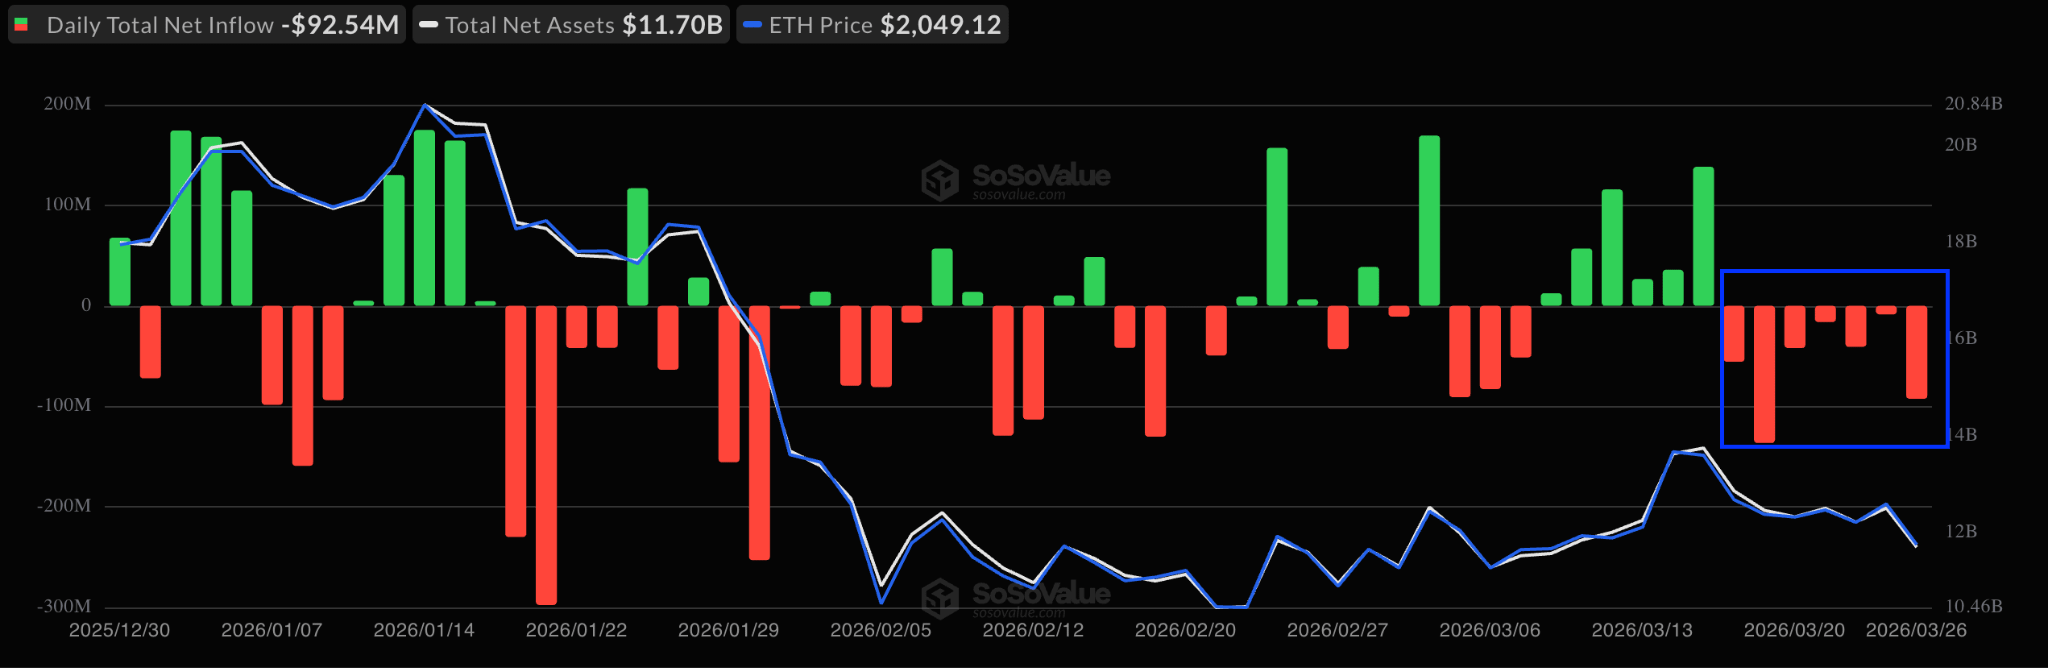 Chart of Ethereum spot ETF flows. Source: SoSoValue
Global exchange-traded products (ETPs) of Ether also recorded outflows of $27.2 million last week, reinforcing the reduction in appetite for ETH among institutional investors.


